This section focuses on years nine and ten, as the Mathematics Framework sets out a few common pathways for grades nine and ten, followed by a plethora of options for later years, as set out in figure 9.1:
Figure 9.1: High School Pathways from the Mathematics Framework (Figure 8.4 in the 2023 CA Mathematics Framework)
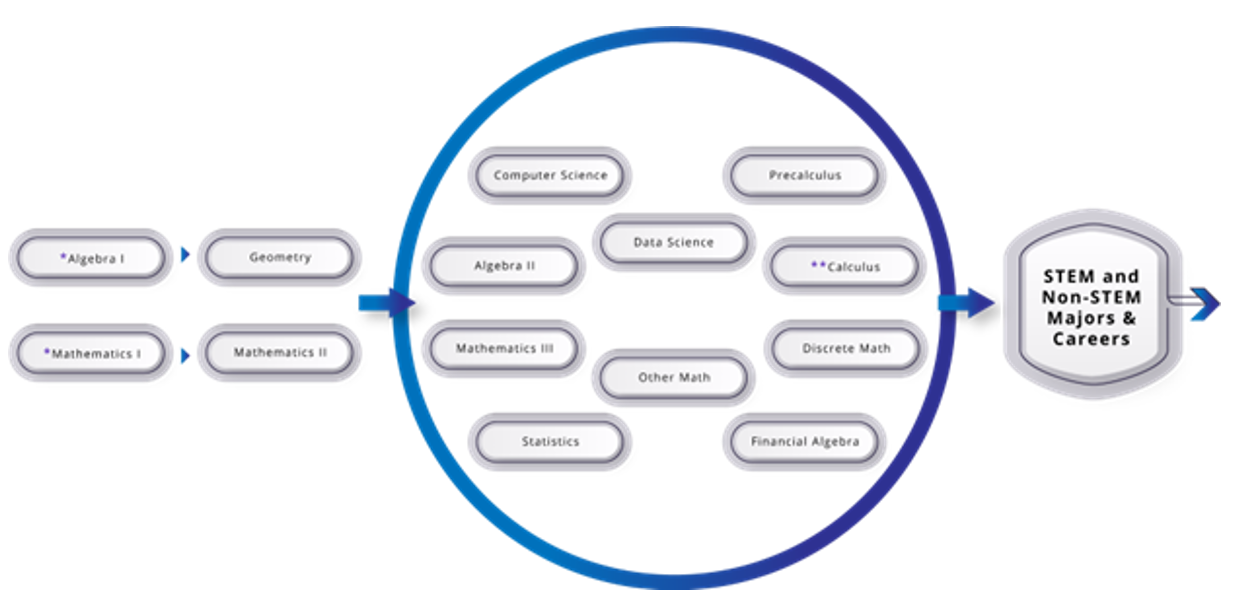
Long description: Diagram indicating two pathways of courses indicating a variety of course offerings for Years 3 and 4 in high school. The preparatory courses are Algebra I and Mathematics I, followed by Geometry and Mathematics II. The later course options include Algebra II, Mathematics III, Computer Science, Statistics, Data Science I, II, Precalculus, Calculus, Discrete Math, Financial Algebra, and Other Math. All of these options lead to Science, Technology, Engineering, and Mathematics (STEM) and Non-STEM Majors and Careers.
In the first two years of high school, the Big Ideas of mathematics fall into three main areas, which are ideally taught together rather than as separate courses. When the content is truly integrated, for example, students learning the content of functions through exciting data explorations, or analyzing the design of buildings with great cultural significance by studying and representing patterns of shapes and their transformations and vectors, then the content of high school comes to life. At this time, students can be learning to develop models and to use technological tools, such as geometry software, data modeling tools, such as CODAP, and programs that provide conceptual insights into computation, such as Desmos and Wolfram-Alpha.
Algebra and Functions
The number sense students developed in kindergarten through grade eight help students see the parallels between numbers (and how they interact) and functions, especially polynomials and rational functions. This area of mathematics should develop students’ ability to recognize, represent, and solve problems involving relations among quantitative variables. Students can start to engage in the modeling of problems, using linear, quadratic, exponential, power, and polynomial functions. The investigations with this content, which fall under the area of “Exploring Changing Quantities” will help students to understand rates of change, growth, and decay functions, and many other topics important to solving problems in the world. As students investigate with the power of mathematical modeling, they will see the ways that they can use mathematics to make sense of the world and impact the future, two of the Drivers of Investigation. Many of the important algebraic topics can be taught through data investigations.
Data Literacy Leading to Data Science
In the high school years, students develop their understanding of variability, learning how to measure and analyze variation. They can also be introduced to large and complex data sets and encouraged to ask their own questions of the data. Ideally, teachers will bring in data sets from their own communities, so that students can use mathematics to solve important problems that help their communities and develop their sense of mathematical agency (Berry et al., 2020). Randomization is an important high school understanding, leading to probability models and sample spaces. Technology plays an important role as it makes it possible for students to generate plots, regression functions, and correlation coefficients.
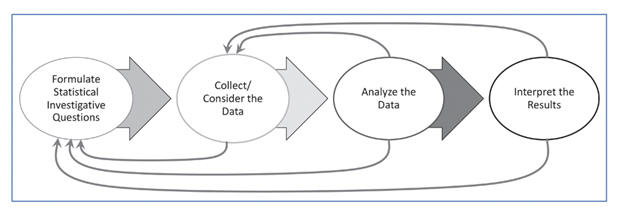
This is the beginning of moving from data literacy to the subject known as “data science” for students and a time when they can be using powerful technological tools to help visualize data distributions and analyze data. Data investigations, represented in figure 9.2, involve many different areas of content, from within and outside mathematics, and students can be encouraged to report on their investigations, communicating their results with words, numbers, and data visualizations.
Figure 9.2. The Statistical and Data Science Investigation Process, from GAISE 2020 (Franklin & Bargagliotti, 2020). (Figure 8.3 in the 2023 CA Mathematics Framework)
Visual and Geometric Reasoning
The third strand of the high school years with ideas from Discovering Shape and Space and Taking Wholes Apart, Putting Parts Together, is in visual and geometric reasoning. Students learn to construct and interpret mathematical models in visual and physical terms. They learn to describe patterns in shape, size, and location, representing patterns with drawings, coordinates, and vectors. Geometric ideas can be developed through experimentation and reasoning, while probabilistic ideas can be developed through geometric sample spaces.
Students who are ELs are encouraged to use their developing English and native language assets (e.g., cognates, morphological awareness) and draw on their prior knowledge. Teachers can examine text and tasks for key language forms and structures, and general as well as discipline-specific, high-utility academic vocabulary words linked to the Big Ideas and connections. Teachers can provide purposeful scaffolds and supports to engage EL students in sustained mathematical discourse in multiple contexts to build academic language and knowledge. Planned and “just-in-time” scaffolds and supports provide multiple entry points for meaning making and sharing of ideas in mathematical ways and include representations, expression starters and builders, and targeted and high-utility academic vocabulary and language structures (e.g., problems, explanations, arguments, descriptions, and connections). Teachers guide deconstruction and/or co-construction of problems, investigations, arguments, explanations, descriptions, and connections. Clear and precise expressions, as well as cohesive writing, support stronger communication of mathematical concepts and practices.
The following interview highlights an educator who is using digital tools to help students in this grade span express their thinking and collaborate with peers on problems, as well as to provide feedback and support as necessary.
Voices from the Field
Kristan Morales | Chaparral High School | Temecula, CA
With 25 years of experience in the classroom, math teacher Kristan Morales focuses on engagement, technology integration, and social-emotional learning. She continues to reevaluate and redesign her math instruction, pushing the envelope with what’s possible in math class in order to better serve her diverse learners.
Morales—who teaches geometry and pre-calculus and serves as a technology coach at Chaparral High School in the Temecula Valley Unified School District—has experienced high levels of student engagement, creativity, and learning outcomes.
How have you overcome the challenges of remote instruction, especially balancing synchronous and asynchronous learning experiences for your students?
For me, whether it’s in-person or virtual, my dominant focus is always about student connections and connectivity. Granted, this has proven to be more challenging online. So, I knew right away that I would have to be intentional in creating opportunities to connect in virtual settings.
I created something I call “What’s Up Weekly.” It starts as a blank slideshow where every student creates a slide asynchronously. The students post their submission each week on a class Padlet (collaborative digital presentation software). So, when I’m online with them, I refer to these slideshows and ask them to share. This is about creating community. I’ve learned so much about them, and they have, in turn, learned so much about one another.
Students buy into the relationship and the connection first, then into the math. One has to create and facilitate situations to hear students’ voices. We have 90-minute classes, and there is no way that we are only going to listen to me talking. Some are reluctant, but I continue to create more ways for students to participate. We have such great tools now—all available to create these different avenues for students to be heard and for teachers to learn from students.
Even our traditional way of sharing our daily agenda has to be rethought. I now use a three-part Hyperdoc: explore, explain, and apply. Everyone can access this—students, parents, special education staff, and counselors.
In what ways are you combining analog and digital tools for distance learning?
There is no way around doing analog work in math. Math teachers have traditionally used notebooks to document student work and check for understanding or mastery. Well, we now can use very dynamic digital notebooks.
Math is built for analog and digital to co-exist and complement one another. For example, we solve problems on paper but can take pictures of them to document. I have my students work in teams and jigsaw the problems. They share with their teams using Jamboards (collaborative digital whiteboards) or Google Slides (collaborative digital presentation software).
There are so many ways to deploy digital tools with analog experiences. For example, while recently learning about radius and 2Pi, I asked my students to find a cylinder at home. It could be anything from lip gloss to a paper towel roll, coffee can, or skateboard wheel. As another example, we recently used household items and photography to study volume and students shared their work on Padlet. I have had success when my students do analog activities but then show their work digitally.
How do these digital tools used during remote instruction enhance what may be done in a traditional classroom setting?
For asynchronous times, I might focus on additional support. I may add a video of me thinking out loud while demonstrating something or working out a math problem. Many teachers will not make a mistake in their problem solving when creating a video. That will leave kids thinking that math is perfect, not messy. When in reality, we need to demonstrate the mistakes. When you make a mistake, neuroscience shows we are learning.
The tools available now can really improve the experience for learners. As an example, I use Desmos for graphing. This amazing free tool allows us to go much further and faster. Recently, we did a lesson using pendulums, and we collected the data in class using pendulums of different lengths. We then used our class data to curve fit the correct function using Desmos and our knowledge of functions. Once we found the best function to match our data, we made a prediction as to how much time it would take for a giant pendulum to swing, and our function from Desmos was very accurate.
We need to see end results more quickly and be able to visualize the learning. My students don’t need to get bogged down in hand graphing. Geogebra is another free tool that is particularly useful for angles and relationships. Like Desmos, students are able to experience the dynamic properties in math. These tools have allowed students to see math in new and powerful ways. Technology doesn’t replace analog but rather enhances the understanding and power of discovery for my students.
I really appreciate incorporating high quality tools that are free and available to all. I also really see value in tools that support all learners. For example, I think tools, such as Google Apps and Pear Deck (a formative assessment platform), are great because of the immersive reader or translation capabilities, making text and images larger and more.
I think tools that provide teachers with high-quality and real-time data and feedback on their students are important, too. Nearpod is a great formative assessment platform that provides teachers insight into what their students are thinking about, learning, or needing is useful. A recent Nearpod focused on special right triangles. Teachers know how to create content, but we need to continue to develop ways for all learners to engage in the content. We’re not spending a lot of money on paper and copies any longer, so let’s keep investing in technology and our students.
Figure 9.3. Progression Chart of Big Ideas, Mathematics I, and Mathematics II
| Content Connections | Big Ideas: Mathematics I | Big Ideas: Mathematics II |
|---|---|---|
| Reasoning with Data | Modeling with functions | The shape of distributions |
| Reasoning with Data | Comparing models | Geospatial data |
| Reasoning with Data | Variability | Probability modeling |
| Reasoning with Data | Correlation and causation | Experimental models and functions |
| Exploring Changing Quantities | Modeling with functions | The shape of distributions |
| Exploring Changing Quantities | Comparing models | Equations to predict and model |
| Exploring Changing Quantities | Variability | Experimental models and functions |
| Exploring Changing Quantities | Systems of equations | Transformation and similarity |
| Taking Wholes Apart, Putting Parts Together | Systems of equations | Functions in the world |
| Taking Wholes Apart, Putting Parts Together | Composing functions | Polynomial identities |
| Taking Wholes Apart, Putting Parts Together | Shapes in structures | Function representations |
| Taking Wholes Apart, Putting Parts Together | Building with triangles | n/a |
| Discovering Shape and Space | Shapes in structures | Circle relationships |
| Discovering Shape and Space | Building with triangles | Trig functions |
| Discovering Shape and Space | Transformations and congruence | Transformation and similarity |
Critical Areas of Instructional Focus for Mathematics I
Figure 9.4. Big Ideas Map for Mathematics I (Figure 8.13 in the 2023 CA Mathematics Framework)
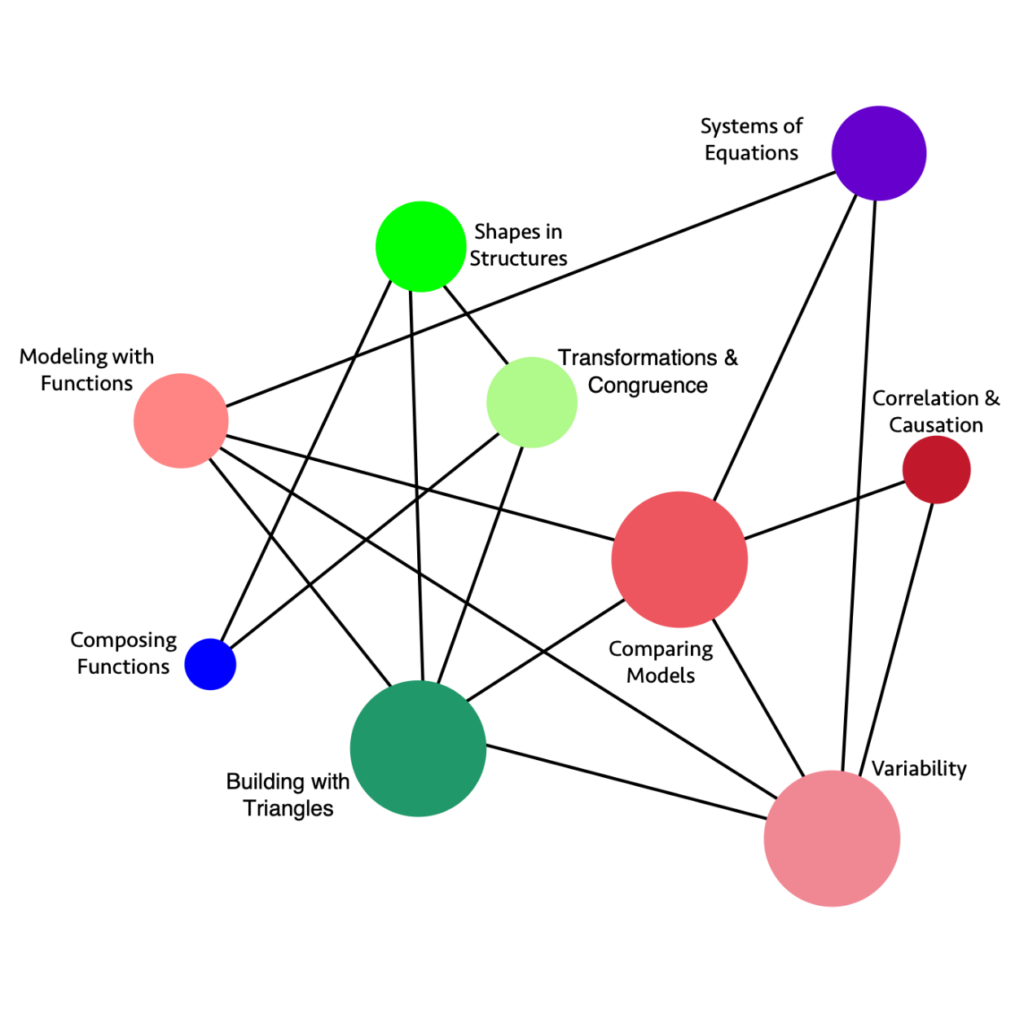
Long description: The graphic illustrates the connections and relationships of some high school integrated mathematics concepts.
Direct connections include:
- Systems of Equations directly connects to: Variability, Comparing Models, Modeling with Functions
- Correlation and Causation directly connects to: Variability, Comparing Models
- Variability directly connects to: Correlation and Causation, Comparing Models, Systems of Equations, Modeling with Functions, Building with Triangles
- Building with Triangles directly connects to: Variability, Comparing Models, Transformations and Congruence, Shapes in Structures, Modeling with Functions
- Composing Functions directly connects to: Transformations and Congruence, Shapes in Structures
- Modeling with Functions directly connects to: Building with Triangles, Variability, Comparing Models, Systems of Equations
- Shapes in Structures directly connects to: Transformations and Congruence, Building with Triangles, Composing Functions
- Transformations and Congruence directly connects to: Building with Triangles, Composing Functions, Shapes in Structures
- Comparing Models directly connects to: Correlation and Causation, Variability, Building with Triangles, Modeling with Functions, Systems of Equations
Figure 9.4a. High School Mathematics I Big Ideas, Content Connections, and Content Standards (Figure 8.14 in the 2023 CA Mathematics Framework)
| Big Ideas | Content Connections | Mathematics I Content Standards |
|---|---|---|
| Modeling with Functions | Reasoning with Data and Exploring Changing Quantities |
N-Q.1, N-Q.2, N-Q.3, A-CED.2, F-BF.1 ,F-IF.1, F-IF.2, F-IF.4, F-LE.5, S-ID.7, A-CED.1, A-CED.2, A-CED.3, A-SSE.1: Build functions that model relationships between two quantities, including examples with inequalities; using units and different representations. Describe and interpret the relationships modeled using visuals, tables, and graphs. |
| Comparing Models | Reasoning with Data and Exploring Changing Quantities |
F-LE.1, F-LE.2, F-LE.3, F-IF.4, F-BF.1, F-LE.5, S-ID.7, S-ID.8, A-CED.1, A-CED.2, A-CED.3, A-SSE.1: Construct, interpret, and compare linear, quadratic, and exponential models of real data, and use them to describe and interpret the relationships between two variables, including inequalities. Interpret the slope and constant terms of linear models, and use technology to compute and interpret the correlation coefficient of a linear fit. |
| Variability | Reasoning with Data and Exploring Changing Quantities |
S-ID.5, S-ID.6, S-ID.7, S-ID.1, S-ID.2, S-ID.3, S-ID.4, A-SSE.1: Summarize, represent, and interpret data. For quantitative data, use a scatter plot and describe how the variables are related. Summarize categorical data in two-way frequency tables and interpret the relative frequencies. |
| Correlation and Causation | Reasoning with Data | S-ID.9, S-ID.8, S-ID.7: Explore data that highlights the difference between correlation and causation. Understand and use correlation coefficients, where appropriate. (see resource section for classroom examples). |
| Systems of Equations | Exploring Changing Quantities and Taking Wholes Apart, Putting Parts Together |
A-REI.1, A-REI.3, A-REI.4, A-REI.5, A-REI.6, A-REI.7, A-REI.10, A-REI.11, A-REI.12, NQ.1, A-SEE.1: Students investigate real situations that include data for which systems of 1 or 2 equations or inequalities are helpful, paying attention to units. Investigations include linear, quadratic, and absolute value. Students use technology tools strategically to find their solutions and approximate solutions, constructing viable arguments, interpreting the meaning of the results, and communicating them in multidimensional ways. |
| Composing Functions | Taking Wholes Apart, Putting Parts Together | F-BF.3, F-BF.2, F-IF.3: Build and explore new functions that are made from existing functions, and explore graphs of the related functions using technology. Recognize sequences are functions and are defined recursively. |
| Shapes in Structures | Taking Wholes Apart, Putting Parts Together and Discovering Shape and Space |
G-CO.6, C-CO.7, C-CO.8, G-GPE.4, G-GPE.5, G.GPE.7, F.BF.3: Perform investigations that involve building triangles and quadrilaterals, considering how the rigidity of triangles and non-rigidity of quadrilaterals influences the design of structures and devices. Study the changes in coordinates and express the changes algebraically. |
| Building with Triangles | Taking Wholes Apart, Putting Parts Together and Discovering Shape and Space |
G-GPE.4, G-GPE.5, G-GPE.6, GPE.7, F-LE.1, F-LE.2, A-CED.2: Investigate with geometric figures, constructing figures in the plane, relating the distance formula to the Pythagorean Theorem, noticing how areas and perimeters of polygons change as the coordinates change. Build with triangles and quadrilaterals, noticing positions and movement, and creating equations that model the changing edges using technology. |
| Transformations and Congruence | Discovering Shape and Space | G-CO.1, G-CO.2, G-CO.3, G-CO.4, G-CO.5, G-CO.12, G-CO.13, G-GPE.4, G-GPE.5, G.GPE.7, F-BF.3: Explore congruence of triangles, including quadrilaterals built from triangles, through geometric constructions. Investigate transformations in the plane. Use geometry software to study transformations, developing definitions of rotations, reflections, and translations in terms of angles, circles, perpendicular lines, and parallel lines. Express translations algebraically. |
Critical Areas of Instructional Focus for Mathematics II
Figure 9.5. Big Ideas Map for Mathematics II (Figure 8.16 in the 2023 CA Mathematics Framework)
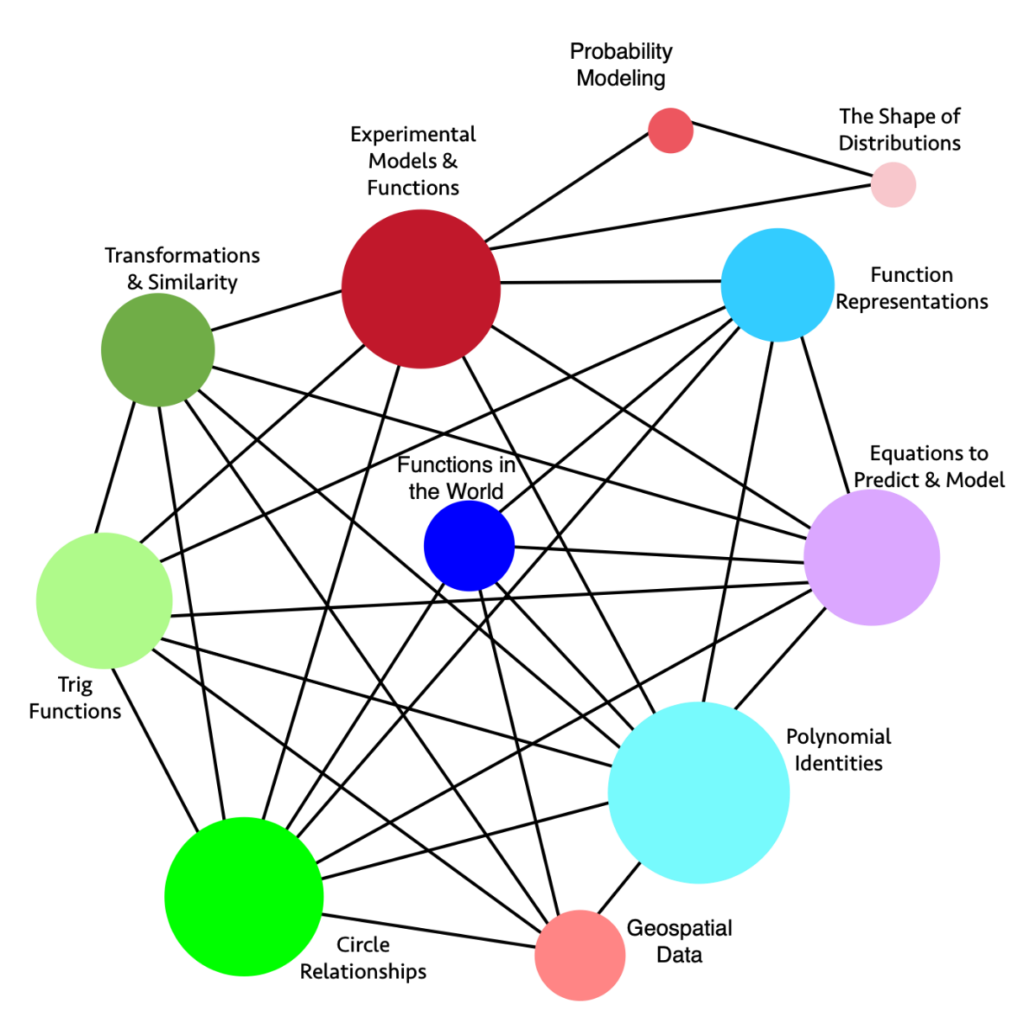
Long description: The graphic illustrates the connections and relationships of some high school integrated mathematics concepts.
Direct connections include:
- Function Representations directly connects to: Equations to Predict and Model, Polynomial Identities, Circle Relationships, Functions in the World, Trig Functions, Experimental Models and Functions
- Equations to Predict and Model directly connects to: Polynomial Identities, Circle Relationships, Trig Functions, Functions in the World, Transformations and Similarity, Experimental Models and Functions, Function Representations
- Polynomial Identities directly connects to: Geospatial Data, Circle Relationships, Trig Functions, Transformations and Similarity, Functions in the World, Experimental Models and Functions, Function Representations, Equations to Predict and Model
- Geospatial Data directly connects to: Polynomial Identities, Functions in the World, Transformations and Similarity, Trig Functions, Circle Relationships
- Circle Relationships directly connects to: Geospatial Data, Polynomial Identities, Trig Functions, Transformations and Similarity, Functions in the World, Experimental Models and Functions, Function Representations, Equations to Predict and Model
- Trig Functions directly connects to: Geospatial Data, Circle Relationships, Polynomial Identities, Transformations and Similarity, Experimental Models and Functions, Function Representations, Equations to Predict and Model
- Transformations and Similarities directly connects to: Geospatial Data, Circle Relationships, Trig Functions, Polynomial Identities, Experimental Models and Functions, Equations to Predict and Model
- Experimental Models and Functions directly connects to: Circle Relationships, Trig Functions, Transformations and Similarity, Polynomial Identities, Function Representations, Equations to Predict and Model, The Shape of Distributions, Probability Modeling
- Probability Modeling directly connects to: The Shape of Distributions, Experimental Models and Functions
- The Shape of Distributions directly connects to: Probability Modeling, Experimental Models and Functions
- Functions in the world directly connects to: Functions Representations, Equations to Predict and Model, Polynomial Identities, Geospatial Data, Circle Relationships
Figure 9.5a. High School Mathematics II Big Ideas, Content Connections, and Content Standards (Figure 8.17 in the 2023 CA Mathematics Framework)
| Big Ideas | Content Connections | Mathematics II Content Standards |
|---|---|---|
| Probability Modeling | Reasoning with Data | S.CP.1, S.CP.2, S.CP.3, S.CP.4, S.CP.5, S-IC.1, S-IC.2, S-IC.3, S.MD.6, S.MD.7: Explore and compare independent and conditional probabilities, interpreting the output in terms of the model. Construct and interpret two-way frequency tables of data as a sample space to determine if the events are independent, and use the data to approximate conditional probabilities. Examples of topics include product and medical testing, and player statistics in sports. |
| The Shape of Distributions | Reasoning with Data | S-IC.1, S-IC.2, S-IC.3, S-ID.1, S-ID.2, S-ID.3, S-MD.1, S-MD.2: Consider the shape of data distributions to decide on ways to compare the center and spread of data. Use simulation models to generate data, and decide if the model produces consistent results. |
| Experimental Models and Functions | Reasoning with Data and Exploring Changing Quantities |
S-ID.1, S-ID.2, S-ID.3, S- ID.6, S-ID.7, S-IC.1, S-IC.2, S-IC.3, A-CED.1, A-REI.1, A-REI.4, F-IF.2, F-IF.3, F-IF.4, F-BF.1, F-LE.1, F-TF.2, A-APR.1: Conduct surveys, experiments, and observational studies––drawing conclusions and making inferences. Compare different data sources and what may be most appropriate for the situation. Create and interpret functions that describe the relationships, interpreting slope and the constant term when linear models are used. Include quadratic and exponential models when appropriate, and understand the meaning of outliers. |
| Geospatial Data | Reasoning with Data | G-MG.1, G-MG.2, G-MG.3, F-LE.6, G-GPE.4, G-GPE.6, G-SRT.5, G-CO.1, G-CO.2, G-CO.12, G-C.2, G-C.5: Explore geospatial data that represent either locations (e.g., maps) or objects (e.g., patterns of people’s faces, road objects for driverless cars) and connect to geometric equations and properties of common shapes. Demonstrate how a computer can measure the distance between two points using geometry and then account for constraints (e.g., distance and then roads for directions) and multiple points with triangulation. Model what shapes and geometric relationships are most appropriate for different situations. |
| Equations to Predict and Model | Exploring Changing Quantities | A-CED.1, A-CED.2, A-REI.4, A-REI.1, A-REI.2, A-REI.3, F.IF.4, F.IF.5, F.IF.6, F.BF.1, F.BF.3, A-APR.1: Model relationships that include creating equations or inequalities, including linear, quadratic, and absolute value. Use the equations or inequalities to make sense of the world or to make predictions, understanding that solving equations is a process of reasoning. Make sense of the real situation, using multiple representations, such as graphs, tables, and equations. |
| Functions in the World | Taking Wholes Apart, Putting Parts Together | F-LE.3, F-LE.6, F-IF.9, N-RN.1, N-RN.2, A-SSE.1, A-SSE.2: Apply quadratic functions to the physical world, such as motion of an object under the force of gravity. Produce equivalent forms of the functions to reveal zeros, max and min, and intercepts. Investigate how functions increase and decrease, and compare the rates of increase or decrease to linear and exponential functions. |
| Polynomial Identities | Taking Wholes Apart, Putting Parts Together | A-SSE.1, A-SSE.2, A-APR.1, A-APR.3, A-APR.4, G-GMD.2, G-MG.1, S-IC.1, S-MD.2: Prove polynomial identities, and use them to describe numerical relationships, using a computer algebra system to rewrite polynomials. Use the binomial theorem to solve problems, appreciating the connections with Pascal’s triangle. |
| Functions Representations | Taking Wholes Apart, Putting Parts Together | F-IF.4, F-IF.5, F-IF.6, F-IF.7, F-IF.8, F-IF.9, N-RN.1, N-RN.2, F-LE.3, A-APR.1: Interpret functions representing real world applications in terms of the data understanding key features of graphs, tables, domain, and range. Compare properties of two functions each represented in different ways (algebraically, graphically, numerically, in tables or by written/verbal descriptions). |
| Transformations and Similarity | Discovering Shape and Space and Exploring Changing Quantities |
G-SRT.1, G- SRT.2, G-SRT.3, , A-CED.2, G-GPE.4, F-BF.3, F-IF.4, A-APR.1: Explore similarity and congruence in terms of transformations, noticing the changes dilations have on figures and the effect of scale factors. Discover how coordinates can be used to describe translations, rotations, and reflections, and generalize findings to model the transformations using algebra. |
| Circle Relationships | Discovering Shape and Space | G-C.1, G-C.2, G-C.3, G-C.4, G-C.5, G-GPE.1, A-REI.7, A-APR.1, F-IF.9: Investigate the relationships of angles, radii, and chords in circles, including triangles and quadrilaterals that are inscribed and circumscribed. Explore arc lengths and areas of sectors using the coordinate plane. Relate the Pythagorean Theorem to the equation of the circle given the center and radius, and solve simple systems where a line intersects the circle. |
| Trig Functions | Discovering Shape and Space | G-TF.2, G-GPE.1, G-GMD.2, G-MG.1, A-APR.1: Model periodic phenomena with trigonometric functions. Translate between geometric descriptions and the equation for a conic section. Visualize relationships between 2-D and 3-D objects. |
Figure 9.6. Progression Chart of Big Ideas, Algebra I, and Geometry
| Content Connections | Big Ideas: Algebra | Big Ideas: Geometry |
|---|---|---|
| Reasoning with Data | Investigate data | Fairness in data |
| Reasoning with Data | Model with functions | Geospatial data |
| Reasoning with Data | n/a | Probability modeling |
| Exploring Changing Quantities | Function investigations | Trig explorations |
| Exploring Changing Quantities | Systems of equations | Triangle congruence |
| Exploring Changing Quantities | Features of functions | Triangle problems |
| Exploring Changing Quantities | n/a | Circle relationships |
| Exploring Changing Quantities | n/a | Points and slopes |
| Taking Wholes Apart, Putting Parts Together | Growth and decay | Triangle congruence |
| Taking Wholes Apart, Putting Parts Together | n/a | Transformations |
| Discovering Shape and Space | Model with functions | Triangle congruence |
| Discovering Shape and Space | Investigate data | Transformations |
| Discovering Shape and Space | n/a | Circle relationships |
| Discovering Shape and Space | n/a | Geometric models |
Critical Areas of Instructional Focus for Algebra I
Figure 9.7. Big Ideas Map for Algebra I (Figure 8.5 in the 2023 CA Mathematics Framework)
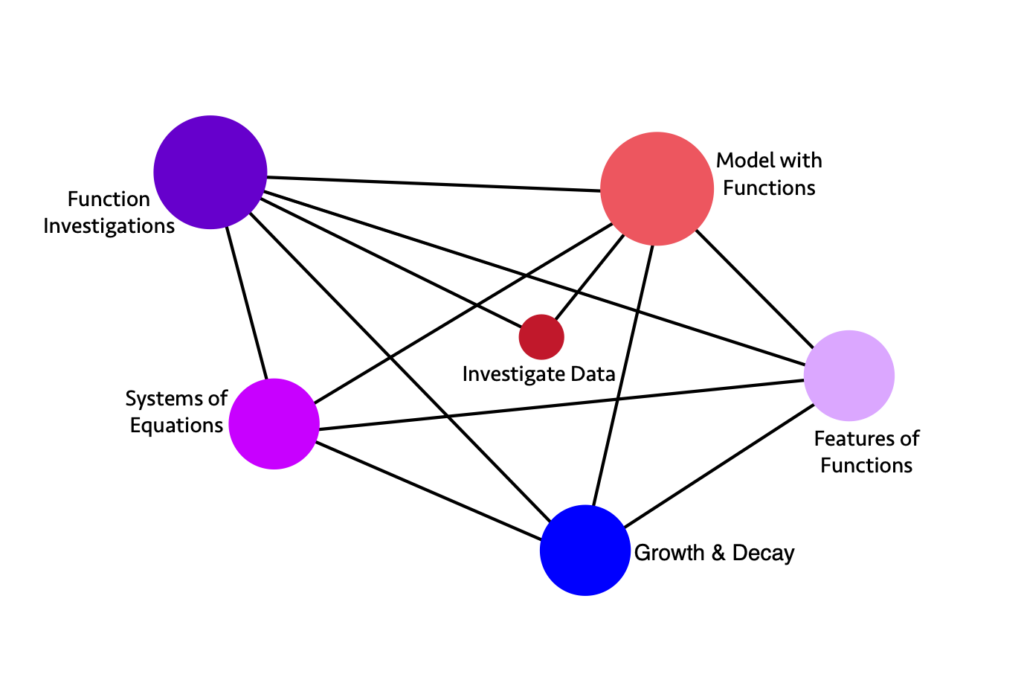
Long description: The graphic illustrates the connections and relationships of some high school algebra mathematics concepts.
Direct connections include:
- Model with Functions directly connects to: Features of Functions, Growth and Decay, Investigate Data, Systems of Equations, Function Investigations
- Features of Functions directly connects to: Growth and Decay, Systems of Equations, Function Investigations, Model with Functions
- Growth and Decay directly connects to: Features of Functions, Model with Functions, Function Investigations, Systems of Equations
- Systems of Equations directly connects to: Growth and Decay, Features of Functions, Model with Functions, Function Investigations
- Function Investigations directly connects to: Model with Functions, Features of Functions, Growth and Decay, Investigate Data, Systems of Equations
- Investigate Data directly connects to: Model with Functions, Function Investigations
Figure 9.7a. High School Algebra I Big Ideas, Content Connections, and Content Standards (Figure 8.6 in the 2023 CA Mathematics Framework)
| Big Ideas | Content Connections | Algebra I Content Standards |
|---|---|---|
| Investigate Data | Reasoning with Data and Discovering Shape and Space |
S-ID.1, S-ID.2, S-ID.3, S-ID.6: Represent data from two or more data sets with plots, dot plots, histograms, and box plots, comparing and analyzing the center and spread, using technology, and interpreting the results. Interpret and compare data distributions using center (median, mean) and spread (interquartile range, standard deviation) through the use of technology.
|
| Model with Functions | Reasoning with Data and Discovering Shape and Space |
F-IF.1, F-IF.2, F-IF.4, F-IF.5, F-IF.6, F-IF.7, F-IF.8, F-IF.9, F-BF.1, F-BF.2, F-BF.4, F-LE.1, F-LE.2, S-ID.5, S-ID.6, S-ID.7, S-ID.8, S-ID.9: Investigate data sets by table and graph and using technology; fit and interpret functions** to model the data between two quantities. Interpret information from the functions, noticing key features* and symmetries. Develop understanding of the meaning of the function and how it represents the data that it is modeling; recognizing possible associations and trends in the data–-including consideration of the correlation coefficients of linear models.
*intercepts, slope, increasing or decreasing, positive or negative **functions include linear, quadratic and exponential |
| Systems of Equations | Exploring Changing Quantities | A-REI.1, A-REI.3, A-REI.4, A-REI.5, A-REI.6, A-REI.7, A-REI.10, A-REI.11, A-REI.12, NQ.1, A-SEE.1, F-LE.1, F-LE.2: Students investigate real situations that include data for which systems of 1 or 2 equations or inequalities are helpful, paying attention to units. Investigations include linear, quadratic, and absolute value. Students use technology tools strategically to find their solutions and approximate solutions, constructing viable arguments, interpreting the meaning of the results, and communicating them in multidimensional ways. |
| Function Investigations | Exploring Changing Quantities | F-IF.1, F-IF.2, F-IF.4, F-IF.5, F-IF.6, F-IF.7, F-IF.8, F-IF.9, F-BF.1, F-BF.2, F-BF.4, S-ID.5, S-ID.6, S-ID.7, S-ID.8, S-ID.9, F-LE.1, F-LE.2: Students investigate data sets by table and graph and using technology; such as earthquake data in the region of the school; they fit and interpret functions to model the data between two quantities and consider the meaning of inverse relationships. Students interpret information from the functions, noticing key features* and symmetries. Students develop understanding of the meaning of the function and how it represents the data that it is modeling; they recognize possible associations and trends in the data––including consideration of the correlation coefficients of linear models.
*one to one correspondence, intercepts, slope, increasing or decreasing, positive or negative |
| Features of Functions | Exploring Changing Quantities | A-SSE.3, F-IF.3, F-IF.4, F-LE.1, F-LE.2, F-LE.6: Students investigate changing situations that are modeled by quadratic and exponential forms of expressions and create equivalent expressions to reveal features* that help understand the meaning of the problem and situation being investigated. (driver of investigation 1, making sense of the world) Investigate patterns, such as the Fibonacci sequence and other mathematical patterns, that reveal recursive functions. *Factored form to reveal zeros of a quadratic function, standard form to reveal the y-intercept, vertex form to reveal a maximum or minimum. |
| Growth and Decay | Taking Wholes Apart, Putting Parts Together | F-LE.1, F-LE.2, F-LE.3, F-LE.5, F-LE.6, F-BF.1, F-BF.2, F-BF.3, F-BF.4, F-IF.4, F-IF.5, F-IF.9, NQ.1, A-SEE.1: Investigate situations that involve linear, quadratic, and exponential models, and use these models to solve problems. Recognize linear functions grow by equal differences over equal intervals; exponential functions grow by equal factors over equal intervals, and functions grow or decay by a percentage rate per unit interval. Interpret the inverse of functions, and model the inverse in graphs, tables, and equations. |
Critical Areas of Instructional Focus for Geometry
Figure 9.8 Big Idea Maps for Geometry (Figure 8.8 in the 2023 CA Mathematics Framework)
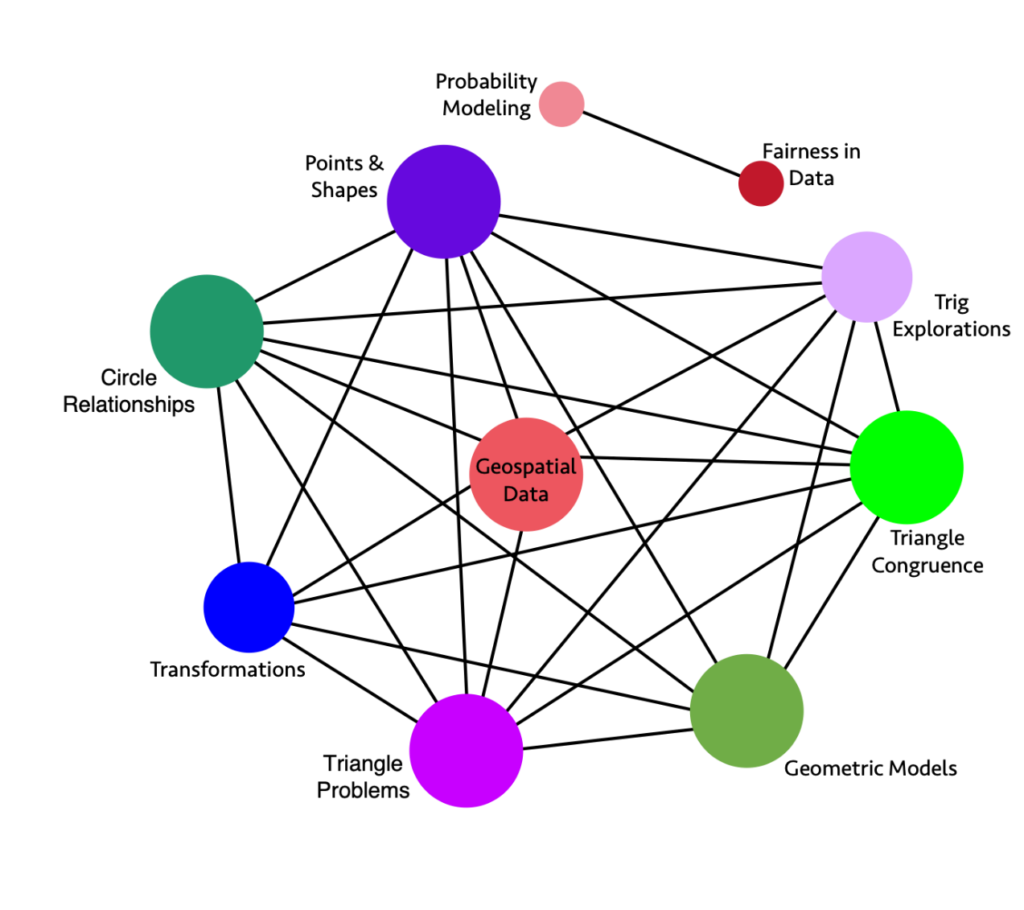
Long description: The graphic illustrates the connections and relationships of some high school geometry mathematics concepts.
Direct connections include:
- Probability Modeling directly connects to: Fairness in Data
- Fairness in Data directly connects to: Probability Modeling
- Trig Explorations directly connects to: Triangle Congruence, Geometric Models, Triangle Problems, Geospatial Data, Circle Relationships, Points and Shapes
- Triangle Congruence directly connects to: Geometric Models, Triangle Problems, Transformations, Geospatial Data, Circle Relationships, Points and Shapes, Trig Explorations
- Geometric Models directly connects to: Triangle Problems, Transformations, Circle Relationships, Points and Shapes, Trig Explorations, Triangle Congruence
- Triangle Problems directly connects to: Geometric Models, Triangle Congruence, Transformations, Geospatial Data, Circle Relationships, Points and Shapes, Trig Explorations
- Transformations directly connects to: Geometric Models, Triangle Problems, Triangle Congruence, Geospatial Data, Circle Relationships, Points and Shapes
- Circle Relationships directly connects to: Geometric Models, Triangle Problems, Transformations, Geospatial Data, Triangle Congruence, Points and Shapes, Trig Explorations
- Points and Shapes directly connects to: Geometric Models, Triangle Problems, Transformations, Geospatial Data, Circle Relationships, Triangle Congruence, Trig Explorations
- Geospatial Data: Triangle Problems, Transformations, Triangle Congruence, Circle Relationships, Points and Shapes, Trig Explorations
Figure 9.8a. High School Geometry Big Ideas, Content Connections, and Content Standards (Figure 8.9 in the 2023 CA Mathematics Framework)
| Big Ideas | Content Connections | Geometry Content Standards |
|---|---|---|
| Probability Modeling | Reasoning with Data | S-CP.1, S-CP.2, S-CP.3, S-CP.4, S-CP.5, S-IC.1, S-IC.2, S-IC.3, S-MD.6, S-MD.7: Explore and compare independent and conditional probabilities, interpreting the output in terms of the model. Construct and interpret two-way frequency tables of data as a sample space to determine if the events are independent and use the data to approximate conditional probabilities. Examples of topics include product and medical testing, and player statistics in sports. |
| Fairness in Data | Reasoning with Data | S-MD.6, S-MD.7: Determine fairness and make decisions based on evaluation of outcomes. Allow students to explore fairness by researching topics of interest, analyzing data from two-way tables. Provide opportunities for students to make meaningful inference, and communicate their findings to community or other stakeholders. |
| Geospatial Data | Reasoning with Data | G-MG.1, G-MG.2, G-MG.3, F-LE.6, G-GPE.4, G-GPE.6, G-SRT.5, G-CO.1, G-CO.2, G-CO.12, G-C.2, G-C.5: Explore geospatial data that represent either locations (e.g., maps) or objects (e.g., patterns of people’s faces, road objects for driverless cars), and connect to geometric equations and properties of common shapes. Demonstrate how a computer can measure the distance between two points using geometry, and then account for constraints (e.g., distance and then roads for directions) and multiple points with triangulation. Model what shapes and geometric relationships are most appropriate for different situations. |
| Trig Explorations | Exploring Changing Quantities | G-SRT.1, G-SRT.2, G-SRT.3, G-SRT.5, G-SRT.9, G-SRT.10, G-SRT.11, GPE.7. G-C.2, G-C.4: Investigate properties of right triangle similarity and congruence and the relationships between sine, cosine, and tangent; exploring the relationship between sine and cosine of complementary angles, and apply that knowledge to problem solving situations. Students recognize the role similarity plays in establishing trigonometric functions, and they use trigonometric functions to investigate situations. Using dynamic geometric software students investigate similarity and trigonometric identities to derive the Laws of Sines and Cosines and use the laws to solve problems. |
| Triangle Problems | Exploring Changing Quantities | G-SRT.4, G-SRT.5, G-SRT.6, G-SRT.8, G-C.2, G-C.4, G-CO.12: Understand and use congruence and similarity when solving problems involving triangles, including trigonometric ratios. Use trigonometric ratios and the Pythagorean Theorem to solve right triangles in applied problems using dynamic geometric software. |
| Points and Shapes | Exploring Changing Quantities | G-GPE.1, G-GPE.2, G-GPE.4, G-GPE.5, G-GPE.6, G-GPE.7, G-CO.1, G-CO.12, G-C.2, G-C.4: Solve problems involving geometric shapes in the coordinate plane using dynamic geometric software to apply the distance formula, Pythagorean Theorem, slope, and similarity rules in solving problems. Investigate equations of circles and how coefficients in the equations correspond to the location and radius of the circles. Find areas and perimeters of triangles and rectangles in the coordinate plane. |
| Transformations | Taking Wholes Apart, Putting Parts Together andDiscovering Shape and Space |
G-CO.1, G-CO.3, G-CO.4, G-CO.5, G-CO.12: Understand rotations, reflections, and translations of regular polygons, quadrilaterals, angels, circles, and line segments. Identify transformations, through investigation, that move a figure back onto itself, using that process to prove congruence. |
| Triangle Congruence | Discovering Shape and Space and Exploring Changing Quantities and Taking Wholes Apart, Putting Parts Together |
G-CO.1, G-CO.2, G-CO.7, G-CO.8, G-CO.9, G-CO.10, G-CO.11, G-CO.12, G-CO.13, G-SRT.5: Investigate triangles and their congruence over rigid transformations verifying findings using triangle congruence theorems (ASA, SSS, SAS, AAS, and HL) and other geometric properties, including vertical angles, angles created by transversals across parallel lines, and bisectors. |
| Circle Relationships | Exploring Changing Quantities and Discovering Shape and Space |
G-C.1, G-C.2, G-C.3, G-C.4, G-CO.1, G-CO.12, G-CO.13, G-GPE.1: Investigate similarity in circles and relationships between angle measures and segments, including inscribed angles, radii, chords, central angles, inscribed angles, circumscribed angles, and tangent lines using dynamic geometric software. |
| Geometric Models | Discovering Shape and Space | G-GMD.1, G-GMD.3, G-GMD.4, G-GMD.5, G-MG.1, G-SRT.5, G-CO.12, G-C.2, G-C.4: Apply geometric concepts in modeling situations to solve design problems using dynamic geometric software.
|
Note: Digital tools and resources to support the implementation of the strategies and considerations identified in this section are included in the Appendices. Please also note that digital tools referenced in Appendix B include free and premium options, and their inclusion in the guidance are largely derived from interviews with California educators. LEAs exercise local control when selecting digital tools and resources. Resources and digital tools included in the guide should not be considered endorsements by the CDE.