Chapter 4 provided information about digital learning in mathematics. The purpose of chapters 5–9 is to present standards and instructional guidance to support the continuum of learning from Transitional Kindergarten (TK)/Kindergarten (K) through grade ten. These chapters prioritize critical areas of instructional focus by grade levels. Attention to these critical areas will ensure that students transition to the next grade level well prepared to learn new skills and concepts. This guidance serves as a companion resource to the California Common Core State Standards: Mathematics (CA CCSSM) and the Mathematics Framework. The organization of the content and practice standards as Big Ideas raises the individual standards to a higher level of Big Ideas and highlights the importance of the content and the ways it is connected to other content and practices. The standards guidance is intended to support teachers as they implement math instruction in online, blended, or in-person learning environments.
California’s goal for all students is that they learn mathematics as a meaningful subject of connected ideas. Teaching with meaning and connections requires a different organization of content and practice standards. The Mathematics Framework advocates for teaching to Big Ideas rather than organizing teaching around the small descriptions of mathematics set out in the standards. Mathematics professor Randy Charles defines a Big Idea as a “statement of an idea that is central to the learning of mathematics, one that links numerous mathematical understandings into a coherent whole” (Charles & Carmel, 2005, p.10). A Big Ideas approach has been shown by research to engage students and increase achievement (Cabana et al., 2014, Makar, 2018). The approach raises the individual standards to a higher level of Big Ideas that show teachers and students the importance of the content and the ways it is connected to other content and practices. As teachers orient their approach to Big Ideas and connections, they will find that there seems to be less content to teach and more time for students to explore ideas and learn deeply. The same content is actually taught and learned, but the organization of connections and Big Ideas allows for a more coherent approach in which students learn different, connected ideas together. The Mathematics Framework has organized Content Connections (CCs) of “Reasoning with data,” “Exploring changing quantities,” “Taking wholes apart and putting parts together,” and “Discovering shape and space,” and this document organizes the Big Ideas under these broad content headings, which are explained in more detail below. Each grade band section (TK–2, 3–5, 6–8, 9–10) shows the progression of Big Ideas across the grades.
The Mathematics Framework includes a principle that mathematics learning in classrooms should always have a purpose and that rather than students working through questions without mathematical direction, they should work on an approach of “investigating and connecting.” To do this, the Mathematics Framework recommends “crosscutting drivers of investigation” that can guide investigations. The drivers are
- making sense of the world (understand and explain);
- predicting what could happen (predict); and
- impacting the future (affect).
Figure 5.1 shows these drivers and the ways they can be applied to any combination of content and mathematical practices.
Figure 5.1. The Drivers of Investigation, Standards for Mathematical Practices, and Content Connections from the Mathematics Framework. (Figure 1.4 in the 2023 CA Mathematics Framework)
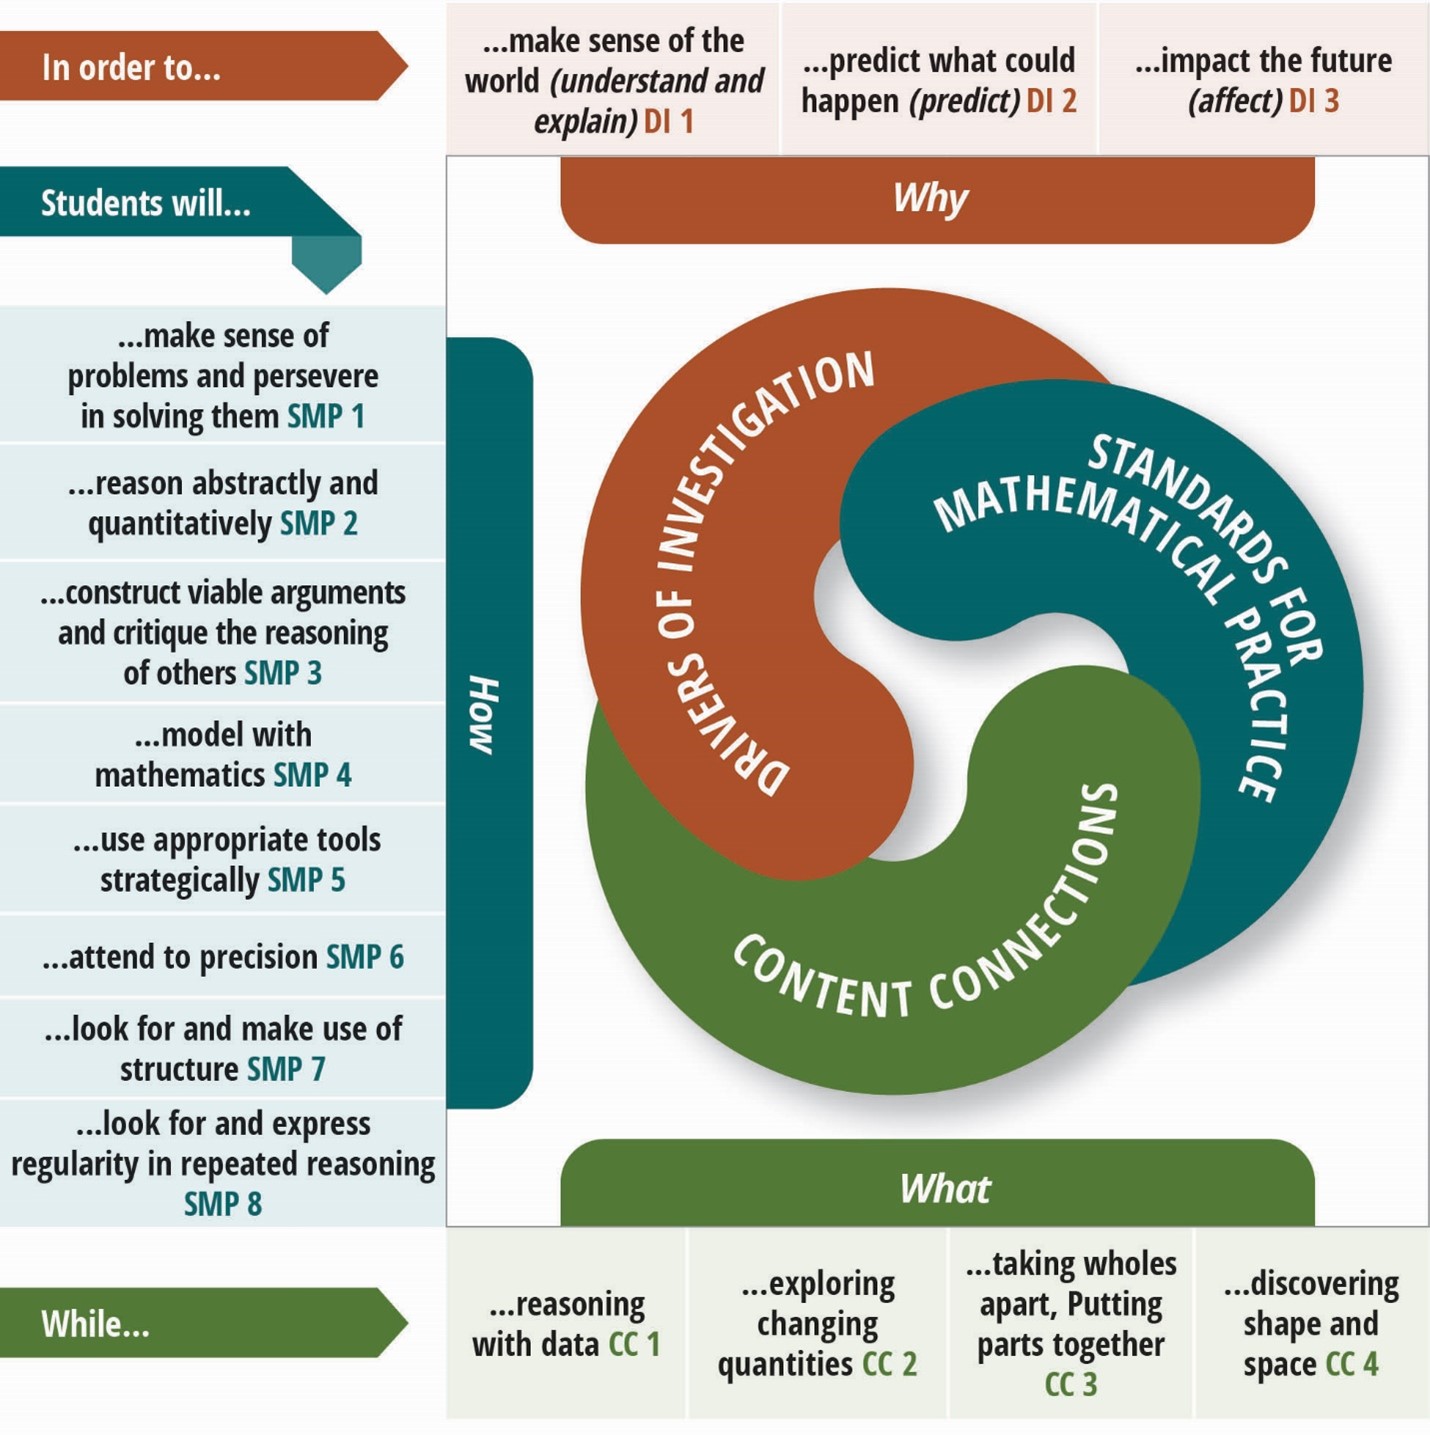
Long description: A spiral graphic shows how the Drivers of Investigation (DIs), Standards for Mathematical Practice (SMPs) and Content Connections (CCs) interact. The DIs are the “Why,” described by the picture with the heading “in order to.” DI1, Make Sense of the World (Understand and Explain); DI2, Predict What Could Happen (Predict); DI3, Impact the Future (Affect). The SMPs are the “How,” listed under the heading “Students will”: SMP1, Make sense of problems and persevere in solving them; SMP2, Reason abstractly and quantitatively; SMP3, Construct viable arguments and critique the reasoning of others; SMP4, Model with mathematics; SMP5, Use appropriate tools strategically; SMP6, Attend to precision; SMP7, Look for and make use of structure; SMP8, Look for and express regularity in repeated reasoning. Finally, the CCs are the “What,” listed under the heading “while”: CC1, Reasoning with Data; CC2, Exploring Changing Quantities; CC3, Taking Wholes Apart, Putting Parts Together; CC4, Discovering Shape and Space.
Big Ideas and Network Maps
The CA CCSSM offer domains, cluster headings, and standards––with most textbook publishers translating the detailed standards into short, procedural questions. A problem with working through standards and associated questions is that teachers do not have time to go in depth on any of the standards, or even to teach them all. A different approach is to consider the Big Ideas, as set out in the introduction to this section, that bring in many different standards, that often go across the clusters and domains. As students work on rich tasks, they will encounter many of the standards but in a more connected and meaningful way. This document sets out this Big Idea approach to mathematics, with the goal of helping teachers and their students, both during a period of decreased learning time and moving forward.
To highlight mathematical connections, each grade has a network map which shows the Big Ideas as nodes. These represent important and foundational content, and an ideal approach to teaching mathematics, in person or online, starts with choosing rich tasks that focus on the Big Ideas. As students explore and investigate with the Big Ideas, they will likely encounter many of the different content standards and see the connections between them.
The size of the node relates to the number of connections it has with other Big Ideas. The connections between Big Ideas are made when the two connected Big Ideas contain one or more of the same standards. The Big Idea colors in the nodes correspond to the table where the Big Ideas are correlated with full descriptions. The descriptions of each Big Idea are not taken from the standards or the clusters or domains; rather, they are new descriptions, as many of the ideas go across clusters and domains. For example, in grade three the Big Idea: Fractions of Shape and Time, brings together standards from the domains of Measurement and Data, Number and Operations in Base Ten, Fractions and Geometry. The new descriptions integrate well with the mathematical practices, as they describe mathematics as a subject of reasoning and communicating. The approach is illustrated through three vignettes, at grades three, eight, and Mathematics II.
Vignette: Santikone Builds Rectangles to Find Area
Grades: Three, four
Content Connections: 2, Exploring Changing Quantities; 4, Discovering Shape and Space
Drivers of Investigation: 1, Make Sense of the World; 3, Impact the Future
Concepts: Measurement, area, perimeter, multiplication
Standards for Mathematical Practice: 2, Reason abstractly and quantitatively; 3, Construct viable arguments and critique the reasoning of others; 5, Use appropriate tools strategically; 6, Attend to precision
Background: Santikone’s third grade class is building understanding of the operations of multiplication and division and concepts of perimeter and area. The teacher plans a two- to three-day lesson, knowing that these are pivotal concepts and that integrating multiple concepts in a meaningful context is more effective than addressing a single concept in isolation. Like many students in the class, Santikone responds with excitement, is actively engaged, and retains learning well when classroom tasks allow students to approach problems in a variety of ways and when the task involves using math tools. One particular tool available to Santikone is an instructional aide who supports the student’s full participation in these activities.
The teacher has chosen a task that addresses third grade measurement and area content, using only whole numbers, while simultaneously calling on skills of multiplication and division. To conclude the lesson, each student will compose a paragraph explaining their reasoning.
Lesson Context: Santikone and their instructional aide listen as the teacher, Ms. B, describes what the class will be doing:
“Our challenge is to find all the ways to make a rectangle with a loop of string that is 36 inches long. Then we will make some decisions about what these rectangles could be used for, and which would be the best choices.”
Ms. B asks students to imagine what the process for this activity will look like, and what part of the rectangles the string would represent. The teacher draws a rectangle on the board, asking students to think about the line as if it were the string. After a few seconds, Ms. B asks children to talk within their small groups about what part of the rectangle the string represents.
As Santikone’s classmates turn to the task, Santikone and their instructional aide also talk through some ideas in preparation for the whole-class discussion: it’s the outside of the rectangle; it’s the edge; it’s like a fence or maybe a wall. The aide nudges Santikone to record their thinking and rehearse their contribution to the upcoming discussion.
Ms. B opens the floor to the whole class, listening as children talk and recording their ideas, including Santikone’s, about what part of the rectangle is represented by the string. That list includes edge, side, outside, fence, area, perimeter, line. In a short discussion after the students finish with this part of the task, Ms. B reminds them of their previous lesson about what they called the “outside” of a polygon. The class agrees that “perimeter” is the word that best fits and that the class will be making rectangles with a perimeter of 36 inches (SMP.3, 6; 3.MD.8).
Noting that the word “area” appears in their list, Ms. B asks students to recall what they have previously learned about area. The teacher says that after students use their string to explore and find rectangles with a perimeter of 36 inches, the class will talk more about area. Ms. B also reminds them that they may find it useful to refer to the classroom’s math wall, that space on one wall where the class has posted definitions, drawings, and counter-examples of the shapes they have studied so far this year.
During the lesson, Santikone’s aide supports the student in shifting their attention as needed, to the term “area,” to the math wall, and so on. Ms. B then provides specific directions, asking students to work collaboratively in their small group:
- Arrange the string to form rectangles along the grid lines on your paper.
- Draw each rectangle on the grid paper, recording length and width in inches along the sides (SMP.2, 5, 6; 3.MD.4).
- Talk within your group about how you know you have found all the possible rectangles (SMP.3, 6; 3.G.1).
- Bring your ideas to the class when we gather to share.
Ms. B supplies each group with a large sheet of one-inch grid paper, rulers, and a string loop. Children gather paper, pencils, and markers they will use to record the rectangles they make and move to their work spaces.
Team Investigation: As students organize themselves to start work, Santikone wonders aloud to their aide whether it is possible to use the same string to make many different rectangles—and how many—and whether they will all have the same area. Upon joining their small group, Santikone immediately picks up the string and tries to make a rectangle on the grid paper. Santikone’s aide joins the group and supports Santikone’s interactions by asking peers to repeat, or revoice, what others say, and making sure that Santikone both listens and is heard. When Santikone tries to form the corners but cannot hold the string still, a teammate volunteers to help. The group decides on a plan for working together: Each person will make one rectangle with a helper, then pass the string to the next person so each person gets to build some of the rectangles. Another team member will draw the rectangle and record its dimensions on the grid paper.
Santikone tries again to form a rectangle that is 4 inches wide. A partner helps by holding the string still at two corners while Santikone stretches the string to find that it makes a length of 14 inches. Another team member draws this first rectangle and writes down its dimensions.
Work proceeds until the group is satisfied they have found all the possible rectangles.
After the students have worked to find all the rectangles, Ms. B calls for attention. The teacher tells the class they get to continue the investigation, directing them to do the following:
- Work with your group to find the area of each rectangle you found; record the area for each rectangle on your drawing (SMP.2,6; 3.MD.5, 6).
- Talk with your group about what each rectangle could represent in the world and be ready to share with the class (SMP.2,3; ELD PI.10,11,12).
Ms. B circulates as groups find the areas of the rectangles, noting the strategies students use. Some count single unit squares, others count how many rows there are in the figure (e.g., 4 square inches in each row), and count by fours to find the total number of square inches. A few students make multiplication connections, such as “Well, there are four in each row and there are 14 rows, so isn’t that like a multiplication problem?” Ms. B hears a student say the area is like an array. Some students discuss whether they should count the 9 by 9 square they have drawn; they are debating whether a square is also a rectangle. Several students express surprise that there were so many rectangles possible and they all have the same perimeter, but not the same area.
Team Presentation: Ms. B reminds students to think and talk with each other about what each different rectangle they have found might represent in the real world, and to get ready to share their discoveries and ideas. Ms. B circulates among the students, encouraging partners to practice out loud with each other what they will say to the class. Particularly attentive to language development, the teacher pauses a few minutes to support all students, including those who are ELs, in their efforts to express their thinking. During this final phase of the group work, Ms. B also identifies a group of posters that represent different approaches and/or organizational methods; the plan is to invite the students who made these posters to present them as a way of initiating the class discussion. One of the posters Ms. B chooses is the one by Santikone’s group, shown here (figure 5.2):
Figure 5.2 Student Poster Illustrating the Thinking of Santikone’s Group in Addressing a Rectangle Problem (Figure C.7 in the 2023 CA Mathematics Framework)
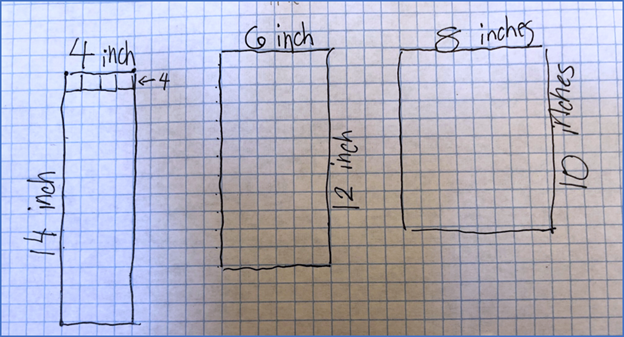
Santikone is excited that their group is asked to share the poster and how the group found the areas of the rectangles. The team members explain how they found each rectangle and report the areas.
Another team shares its thinking, explaining that students figured out they could find areas by multiplying. A rectangle of width 1 inch had a length of 17 inches, and there were 17 square inches in that area. They noticed that 1 × 17 = 17, and that meant they could multiply to find the area.
A lively discussion develops regarding whether the 9 by 9-inch square should be included in the list of rectangles, and Ms. B welcomes this discussion of important grade-level mathematics. Aware that students often need extra time to develop understanding of a square as a special example of the category of rectangles, the teacher asks teams to review their knowledge of what makes a rectangle, something they had discussed previously. Together, the class members review what they had talked about and come up with a list of three characteristics of rectangles:
- They have four sides.
- They include square corners.
- They have two sides across from each other that are the same lengths.
Casey agrees with the list in general, but wants to add another characteristic, that rectangles have to have two long sides and two short sides. Sumira challenges: “Why do there have to be long sides and short sides? I thought when we talked before we said all the sides could be the same, like in a square.” Santikone walks to the math wall and reviews the pictures and descriptions of rectangle and square that are posted. Santikone comes back and excitedly tells Sumira that they agree. With a few more minutes of discussion, the class comes to consensus and includes the 9 by 9-inch square rectangle in the list of nine possible rectangles with whole-number length sides, and a perimeter of 36.
Ms. B focuses attention on the questions of which rectangle has the greatest area, and which rectangles would be most useful at school, at home, or in the community, and why.
Students talk a few moments about whether a “long, skinny” or a “shorter, wider” rectangle is better. When the class discussion resumes, Santikone comments that the 1 by 17 rectangle is so long and skinny it would not be useful for many things, and wider ones are probably better for most things. Another student says that some of the rectangles look like they are the shape of a book or a door. Others describe how various rectangles could be the shape of a playground, a pool, a garden, or a sandbox. A number of students claim the rectangles that have the largest areas (the 8 by 10 rectangle and the 9 by 9 square rectangle), would be the “best” for most things.
Lesson Extension and Conclusion: Ms. B introduces a plan for students to write in their journals: they will explain why there are so many different rectangles that have the same perimeter, describe how they could use one of the rectangles to represent something real (e.g., dog run, pool, garden), and explain why they made that choice. Ms. B attends to the students who are ELs and reminds them of the sentence frames they have used and found helpful in past lessons. Ms. B invites them to practice by sharing their responses with a partner and reading their written work aloud when they are finished.
Santikone, having already decided that a pool would be the perfect way to use a rectangle explains this choice in their journal and illustrates a sunny day, blue sky, and a “long, medium-skinny” pool.
Vignette: What’s a Fair Living Wage?
Grade level/Course: Grade eight mathematics
Drivers of Investigation: 3, Impacting the Future
Content Connections: 1, Reasoning with Data
Standards for Mathematical Practice: 1, Make sense of problems and persevere in solving them; 2, Reason abstractly and quantitatively; 3, Construct viable arguments and critique the reasoning of others; 4, Model with mathematics; 5, Use appropriate tools strategically; 6, Attend to precision
CA CCSSM Content Clusters/Standards:
8.EE.8.B
Solve systems of two linear equations in two variables algebraically, and estimate solutions by graphing the equations. Solve simple cases by inspection. For example, 3x + 2y = 5 and 3x + 2y = 6 have no solution because 3x + 2y cannot simultaneously be 5 and 6.
8.EE.8.C
Solve real-world and mathematical problems leading to two linear equations in two variables. For example, given coordinates for two pairs of points, determine whether the line through the first pair of points intersects the line through the second pair.
8.F.2
Compare properties of two functions each represented in a different way (algebraically, graphically, numerically in tables, or by verbal descriptions). For example, given a linear function represented by a table of values and a linear function represented by an algebraic expression, determine which function has the greater rate of change.
8.F.4
Construct a function to model a linear relationship between two quantities. Determine the rate of change and initial value of the function from a description of a relationship or from two (x, y) values, including reading these from a table or from a graph. Interpret the rate of change and initial value of a linear function in terms of the situation it models, and in terms of its graph or a table of values.
This lesson focuses on how understanding of mathematics informs understanding of the world, including social justice issues (Berry et al., 2020). Designed to span 90 minutes, this lesson begins with students discussing what they know about living wages and minimum wages. Students are invited to explore and unpack a data visualization (figure 5.3) showing how many hours of work at minimum wage are needed to afford rent in different states in the US.
Figure 5.3 Data Visualization of Hours at a Minimum Wage Needed to Afford Rent (Figure C.11 in the 2023 CA Mathematics Framework)
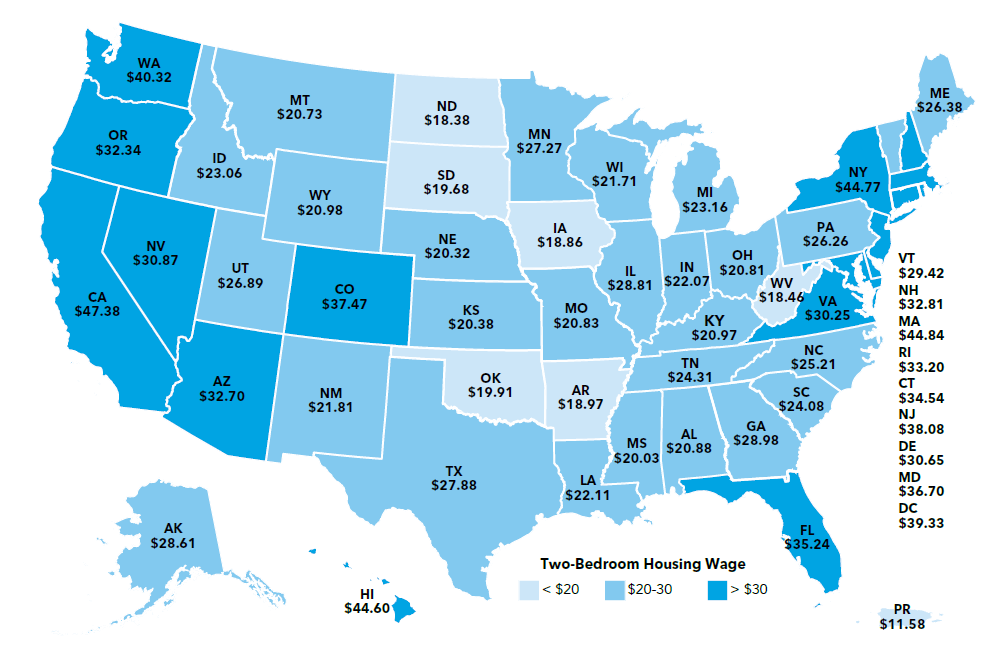
Long description: This 2024 graphic from the National Low Income Housing Coalition shows hourly wages that a full-time worker must earn to afford Fair Market Rent for a two-bedroom rental home without paying more than 30 percent of their income. A full-time worker is defined as someone who works 40 hours per week and 52 weeks per year. The map is broken down by hourly wages needed in three categories: less than $20, $20–$30, and greater than $30.
States that require an hourly wage of less than $20 are North and South Dakota, Oklahoma, Arkansas, Iowa, West Virginia, and Puerto Rico. The bulk of States require an hourly wage of $20–$30. They are Montana, Idaho, Utah, Wyoming, New Mexico, Nebraska, Kansas, Texas, Minnesota, Missouri, Louisiana, Wisconsin, Illinois, Mississippi, Alabama, Tennessee, Kentucky, Indiana, Michigan, Ohio, Maine, Pennsylvania, North and South Carolina, Vermont, and Alaska. States that require an hourly wage for a full-time worker greater than $30 are Washington, Oregon, California, Nevada, Hawaii, Arizona, Colorado, New York, Virginia, Florida, New Hampshire, Massachusetts, Rhode Island, Connecticut, New Jersey, Delaware, Maryland, and the District of Colombia.
Source: National Low Income Housing Coalition, 2024.
The lesson also includes a video from CNBC.com and a link to a living wage calculator. After students discuss and consult different resources, the teacher can brainstorm a list of questions that students have about what a living wage is.
Students then work in groups, guided by task cards that describe a particular family and its needs and by focused teacher questions, to consider how many hours each family needs to work in order to pay rent for the type of apartment it needs.
Student Task Cards
RED task card: 1 adult
You are a male who just graduated from high school and need to move out on your own. You found a job making $10.50 per hour, minimum wage for nontipped employees in Chicago, as a restaurant line cook. You work 40 hours per week.
GREEN task card: 1 adult; 1 child
You are a young single mom with one child, and you work as a server at a restaurant. You work 40 hours a week at minimum wage, which, because you also earn tips, is $5.95 per hour. You average about $360 per week in tips.
BLUE task card: 2 adults; 2 children
You are a family with two children under the age of five. Mom stays home to take care of the children. Dad works 40 hours per week at a construction company that pays two times minimum wage. Minimum wage where you live is (Fill in current minimum wage).
YELLOW task card: 1 adult
You are a young, single woman going to school part time and working full time (40 hours per week). You work at the same construction company as the dad of the BLUE family, but most women (including you) make 64 percent of what men at the company make.
ORANGE task card:1 adult
You are a female full-time student who also works 20 hours per week. You work in the library, where you earn the minimum wage of (insert current minimum wage) per hour. However, you also have a scholarship that provides $1,000 at the beginning of every month.
PURPLE task card: 2 adults; 2 children
You are a two-mom family with two children. Both of your children are in school, so both moms work full time (40 hours per week). Both found jobs working for a distribution center in Illinois. The distribution center pays employees $13.00 per hour.
What’s a Fair Living Wage? Part I
Teacher: Today, you’ll be working in groups to figure out the hourly wage necessary for a family in Chicago to afford housing. You will look at real data about hourly wages (the amount of money someone earns per hour) and the cost of renting each month. Your goal is to use mathematics to decide whether or not you think the six families in Chicago are paid fair wages.
As a team, do the following: Figure out how many hours each family needs to work to pay rent for the type of apartment you think is best for the family.
Guidelines:
Draw a graph and write an equation for each family’s earnings over time.
Use a different color pencil/marker for each family.
Identify the dependent and independent variables. Use the following data about fair housing rental prices for monthly rent:
| Studio | 1 Bedroom | 2 Bedroom | 3 Bedroom | 4 Bedroom |
| $860 | $1,001 | $1,176 | $1,494 | $1,780 |
Data source: HUD, n.d.
Your team must work cooperatively to solve the problems in this task. No team member individually has enough information to solve the problems alone!
Each member of the team will select a task card—Red, Green, Blue, Yellow, or Orange. Do not show your card to your team. You may only communicate the information on the card.
Everyone can see the PURPLE task card.
Assume there are four weeks in one month.
You might not need to use all the information on your card to carry out the task.
STOP
Check in with your teacher before you answer the next questions.
As students work in groups, the teacher asks the following questions:
What percentage of their income do you think people usually spend on housing, food, and other essentials in our area? Is this fair and just? Financial advisors recommend that people spend no more than 30 percent of their monthly income on housing.
According to the National Low-Income Housing Coalition, the average hourly wage needed to rent a modest two-bedroom home in California is above $23. Based on your experiences and this task, does this seem reasonable or unreasonable, and why?
How did you decide how many hours of work sufficed to pay rent for the family on your task card on the graph, the table, and/or the equation? How can you determine how much the family on your task card makes if they don’t work? What does it mean when the families represented on two different task cards intersect? Do they make the same wage? Who makes more money? Will other lines cross? How do you know? What would be a fair hourly wage for our own city/state/community? How do you know that wage would be fair? Use the graph, table, or equation to explain how you know.
Grade Ten Vignette: Teaching to Big Ideas
Vignette from Mathematics II: Cable Ready––from high school teachers Lisa Doak, Sally Collins, and Kenny Reisman, from the Interactive Mathematics Program.
This is an activity that satisfies the Mathematics II Big Idea: “Equations to predict and model,” which includes standards from the different domains: “Creating equations,” “Reasoning with equations and inequalities,” “Interpreting functions,” “Building functions,” and “Arithmetic with polynomials and rational expressions.” Depending on the directions students decide to take the investigation, the task may also address the Big Idea of “Circle relationships” and the domain of “Circles,” or the Big Idea of “Trig Functions” and the domain of “Trigonometric Functions.” The activity supports learning inside the Standards of Mathematical Practices: 1. Make sense of problems and persevere in solving them, 2. Reason abstractly and quantitatively, 3. Construct viable arguments and critique the reasoning of others, 4. Model with mathematics, 5. Use appropriate tools strategically, 6. Attend to precision, 7. Look for and make use of structure, and 8. Look for and express regularity in repeated reasoning.
Activity: Cable Ready
When Madie and Clyde bought their orchard, a straight electrical cable ran along the ground from the center of the orchard, at (0, 0) in their coordinate system, to the point (30, 20).
1. They wanted to start their planting while they waited for the electrical company to move the cable safely underground, but they had to be sure not to plant trees right on the cable. Keep in mind that Madie and Clyde plant trees at every lattice point in the orchard.
a. Could they plant a complete mini-orchard of radius 1 at the center of their lot without planting right on the cable?
b. Answer the same question for a mini-orchard of radius 2.
c. What is the radius of the biggest complete mini-orchard Madie and Clyde could plant without planting on the cable? Assume the tree trunks are very thin.
2. Suppose Madie and Clyde plant the biggest possible mini-orchard from Question 1c. How big will the tree trunks have to become before one of them bumps into the cable? With your group, prepare a presentation that summarizes your work on Question 2 for presentation to the class. (Interactive Mathematics Program, Activate Learning)
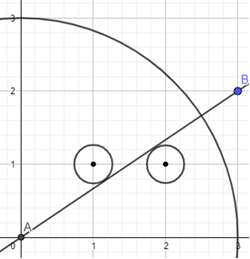
Mathematically, students are trying to find the distance from a point to a line. In this example, they are trying to find the radius of the circle which is tangent to the line AB. In a virtual setting, students can work together in small groups organized in a breakout room. They can work together discussing their strategies and working towards creative solutions using Desmos or other geometric software.
Figure 5.4. A Visual Representation of the Problem
Students have presented several different methods for solving the problem. A sample of those methods are provided below:
(1) Algebraic: As shown in figure 5.5, students find the equation of the line represented by the cable and then find the equation of the line perpendicular to it through the point (1, 1). They then find the intersection point of those two lines by solving a system of equations. Finally, they find the distance between that intersection point and the center of the tree at (1, 1).
Figure 5.5. An Algebraic Solution
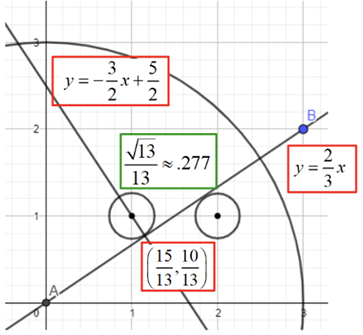
Long description: An algebraic solution to the problem shown visually. A quarter circle is drawn with center at the origin labeled point A with a radius of 3 units. A line is drawn from the origin and through point B located at (3,2). The equation of Line AB is y equals two-thirds x. Another line is constructed through a point located at 15 thirteenths and 10 thirteenths that is perpendicular to line AB. The equation of this line is y equals negative three halves x plus five halves.
(2) Geometric: As shown in figure 5.6, students use similar triangles found with alternate interior angles of parallel lines, as well as the Pythagorean Theorem, to find the hypotenuse of the larger triangle. The .5 length is established by showing that any line through the midpoint of a segment connecting two points is equidistant from the two points.
Figure 5.6. A Geometric Solution
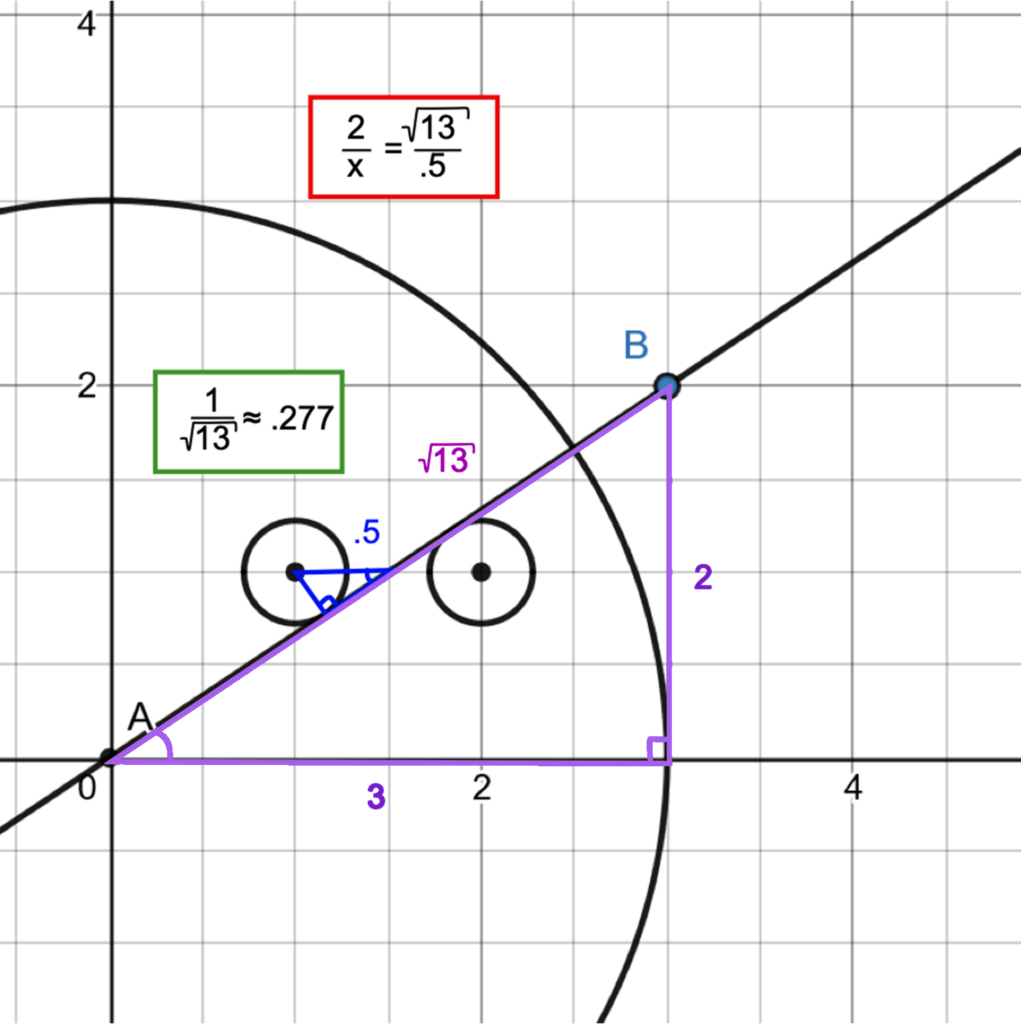
Long description: A geometric solution to the problem shown visually. It shows a quarter circle with center at (0,0) and a radius of 3 units. A line is drawn from the origin to point B at point (3,2). The hypotenuse of the triangle formed by points A,B has a radius of square root of 13.
(3) Trigonometric: As shown in Figure 5.6, students use alternate interior angles of parallel lines for congruent angles.
Figure 5.7. A Trigonometric Solution
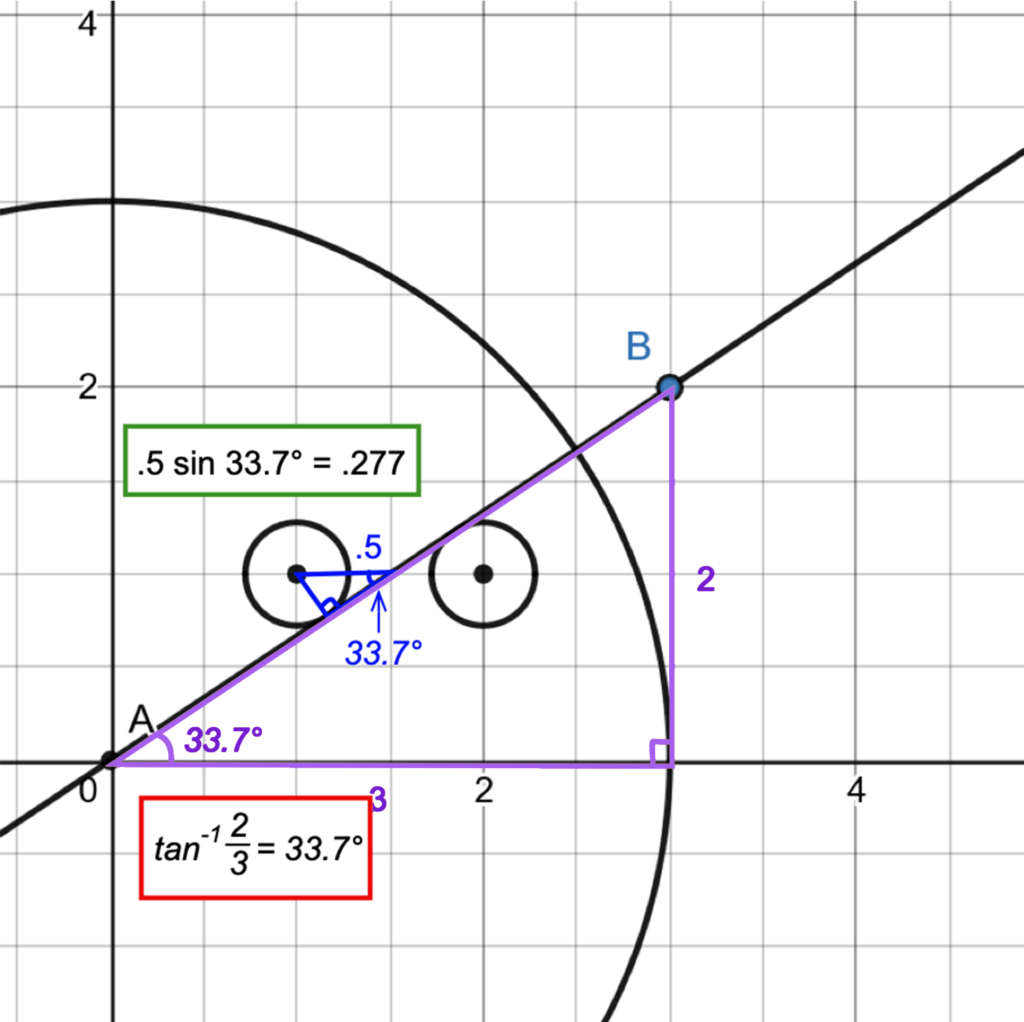
Long description: A trigonometric solution to the problem shown visually. A quarter circle is drawn with center at the origin and labeled point A with a radius of 3 units. A line is drawn from the origin and through point B located at point (3,2). A triangle is constructed from points A, B and a point at (3,0). A circle is drawn with center at point (1,1) with a point on the circle tangent to line AB. A triangle is constructed showing the distance from the circle perpendicular to line AB is .277.
Mathematics Through the Key Themes of English Language Arts/Literacy and English Language Development
The relationship between this document and the key themes of the English Language Arts (ELA)/English Language Development (ELD) Framework, can be found in these areas:
Meaning Making: Mathematics, as a lens and a language, has meaning and sense-making as its central purpose. As a lens, mathematics brings patterns, connections, and relationships into focus, allowing students to describe, inspect, and, in many cases, apply these relationships in novel contexts, expanding mathematical knowledge in infinite directions. Mathematics is integral to understanding important human endeavors, such as public health, economic growth, and sustaining the environment, among many others. The recommendation of the Mathematics Framework is that teachers give mathematics problems to students that encourage them to investigate and connect ideas, through the three drivers of investigation shown in figure 5.1. These drivers give mathematics purpose, as they invite students to use mathematics to understand and explain the world, to describe patterns that can help predict what comes next, or to consider a range of actions to impact the future. Meaning and sense-making is an active process for learners that is intellectually satisfying, propelled by challenging mathematics tasks, supportive instruction, and opportunities to use a full range of classroom and language resources, including collaborators and tools.
Foundational Skills: A foundational skill in mathematics is flexibility. As students learn to investigate with numbers by composing and decomposing numbers, and using different strategies, they learn to make sense of the base-10 number system. The same flexibility is developed with symbol sense in algebra, thinking visually in geometry, and data sense in data science, and onwards. Flexibility allows students to orient themselves and navigate within mathematical terrains.
Language Development: Like all disciplines, mathematics has its own specialized system of encoding and communicating its concepts, knowledge, and understandings over time. This system includes words, numbers, symbols, graphs, diagrams, and, increasingly, many other forms of visual displays. Knowing a term or expression is to have a clear understanding of how to use it in a particular context and be aware of its relationship to other words. For students, and in particular for EL students, it is useful to identify and develop the high-utility academic vocabulary within units of study. Students can also be provided opportunities to utilize their native tongue when they are initially learning concepts (see also Gutierrez, 2018). Teachers can build understanding of how these words are enacted, defined, and used in mathematical ways, text, and tasks over time. Academic vocabulary includes general abstract words used across disciplines (e.g., compare, measure, evaluate, analyze, induce, deduce), abstract discipline-specific words (e.g., proportionality, equivalency, function), and technical discipline-specific words (e.g., variable, diameter, volume, cube, monomial, segment, numerator, hypotenuse). To engage in effective disciplinary discourse and produce using the mathematical register, students need multiple experiences with the forms and structures of the discipline’s genres: problem solving, argument, explanation, and procedure. Teachers can support students who are ELs by examining the language demands and language opportunities of texts and tasks and by guiding the deconstruction and/or co-construction of text and tasks for a particular purpose. Over time, students learn to read and write using the particulars of grammar and syntax of mathematics conventions, while also inventing their own representations, visuals, and inscriptions to express their emerging ideas. In this way, students develop their own mathematical voice and mathematical perspective, which they use to express themselves.
Effective Expression: While outdated stereotypes cast mathematics as a solitary enterprise, mathematics is continually built from and with a community of learners. By participating in classroom communities, for example, students learn to express themselves mathematically in a variety of forms. Reasoning is at the heart of the discipline of mathematics, and students learn to reason when they share their emerging ideas with each other, justify their thinking, act as skeptics for each other, and defend their methods and approaches. Classrooms are effective when teachers encourage students to share their conjectures, or mathematical ideas that students are not yet sure about, which other students can then discuss. Teachers can increase the level of expression for students who are linguistically and culturally diverse learners of English by strategically grouping them with peers who support and/or enhance their sharing of emerging ideas using their language assets, providing purposefully planned and “just-in-time” scaffolds for sustained communications, making explicit the academic language goals, and supporting the development and use of academic vocabulary (general, abstract, and technical discipline-specific). Mathematical communication is an important part of all mathematical work, in employment and in the discipline of mathematics. As students learn to formulate conjectures and then set out to explore and explain their ideas with increasing detail and examples, such as cases, they will learn mathematical communication. As ideas take shape, students may also develop models and arguments to engage stakeholders, audiences, and skeptics. When ideas have sufficiently matured, students may formalize their ideas in the form of proof, constructing a logical chain of reasoning that is validated by the members of the mathematics community. Proofs and other forms of derived results become the basis of new conjectures.
Content Connections in the Mathematics Framework
The Big Ideas set out in this document have been organized according to the CCs of the Mathematics Framework. Each of these CCs is outlined below:
CC1. Reasoning with Data
Data is all around, and an important goal for teachers is helping their students develop data literacy so that they can read and understand data in the world. In the older grades, this develops into an understanding of the important new discipline: data science. In the younger grades, students learn to identify data, measure and classify objects, and make and read data visualizations. In the middle grades, students learn to reason with data using statistical methods, collecting and using data from their lives, and continuing to interpret and make data visualizations. In the high school years, students continue to reason about and with data, and many of the algebraic concepts students learn, particularly functions, can be learned through data investigations. This area of mathematics lends itself to integration of mathematics with other disciplines, such as science and social sciences, as well as with data students meet and care about in their lives. It also provides extensive opportunities to show how mathematics and data science can be utilized to address social injustices and inequities, as students investigate topics such as redlining voter suppression, wealth gaps, food insecurity, agriculture, the environment, and healthcare (Berry III et al., 2020; Gutstein, 2007).
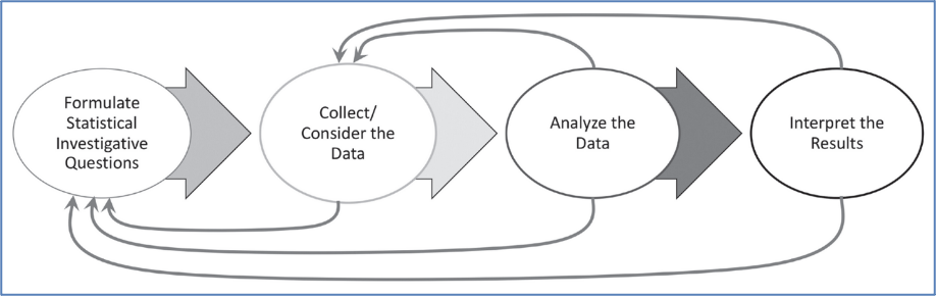
Figure 5.8. The statistical and data science investigation process, from GAISE 2020 (Franklin & Bargagliotti, 2020) (Figure 8.3 in the 2023 CA Mathematics Framework)
CC2. Exploring Changing Quantities
One of the most powerful uses of mathematics in school and in the world is making sense of change. In the early grades, students are fascinated to learn that adding to a group of objects gives a different number and that the number can be arrived at in many different ways. As students learn number flexibility and number sense, they will learn to change numbers through the use of different operations, such as addition, subtraction, multiplication, and division. They will also learn about the ways mathematics can be applied to changed quantities in the world (e.g., weight, length, value, and in later grades, speed, and acceleration). Mathematicians must find ways to represent the relationships between quantities in order to make sense of and model complex situations. To explore and make sense of changing quantities is an important area of mathematics that applies across mathematical grades and situations.
CC3. Taking Wholes Apart, Putting Parts Together
An important practice that is a tool for the solving of most mathematical problems is the act of breaking a large problem into smaller parts, which are investigated, solved, then put back together into a whole. All mathematical content can be considered in this way; in this document, and within the Mathematics Framework, the content chosen provides particular insights when it is decomposed into manageable pieces and then reassembled. When an investigation is included in this area, it is crucial that decomposing and reassembly is a student task, not one that is taken on by a teacher or a textbook. As students learn to “take wholes apart and put parts together,” they will learn an important mathematical approach to the solving of complex problems.
CC4. Discovering Shape and Space
In all grades, it is important to realize that “visual thinking” or “geometric reasoning” is as legitimate as algebraic or computational thinking. In the early grades, students describe their worlds using geometric ideas, taking time to explore the nature of shapes and spaces in the world. As students move through the grades, they should continue this focus, also breaking shapes apart, and combining them, and relating them to measurement. Three-dimensional (3-D) visualization and modeling are important twenty-first century understandings intrinsic to many jobs. Geometry software helps this area of mathematics come to life and is especially important in the high school years. The Mathematics Framework supports visual thinking by defining congruence and similarity in terms of dilations and rigid motions of the plane, and emphasizing physical models, transparencies, and geometry software.
Math Talks, Grades Transitional Kindergarten Through Twelve
Number sense—the ability to use, adapt and think flexibly with numbers—is an important mathematical foundation and a precursor to higher level mathematics achievement. Number sense is a Big Idea that extends across all of the grades. A pedagogical practice that is highly effective for encouraging number sense is a “math talk,” sometimes referred to as a “number talk” and related to the practice of a “number string.” These can be used with students of all grade levels, including college students. The structure of a math talk is the following: The teacher gives a number problem to the class of students and asks students to think, mentally, about a way to solve it, without pen and paper. The teacher then asks for the different answers that may be produced and asks students to defend their answers using mathematical reasoning. Teachers can engage EL students in math talks by providing purposeful sentence frames and open-ended questions to build extended conversations, build fluency, and encourage struggle, which is important for brain development. Math talks provide powerful language models for EL students. This structure may be adapted in different ways. For example, students can turn and talk to partners before sharing their solutions. Students who are ELs are encouraged to use their language assets in English and native languages and might be partnered with peers accordingly. As students are using language to convey mathematical ideas, it helps with the development of language and reasoning as set out in the California English Language Development Standards. In the course of a math talk, students often adopt methods that another student has presented that make sense to them. Math talks, designed to highlight a particular type of problem or useful strategy, serve to advance the development of efficient, generalizable strategies for the class. These class discussions provide an interesting challenge, and teachers can create a safe place in which students can explore, compare, and develop strategies.
Effective math talks can advance students’ capacity for collaborative, interpretive, and productive communication, helping them develop a positive mathematical identity. They show something important––that mathematics problems can be approached in different ways; they highlight mathematical creativity, and they support the development of number sense. Math talks also integrate mathematics content and mathematical practices, especially SMP 2, 3, 4, 6, 7, and 8.
Math talks can be enacted using technology during distance learning. A teacher can put the number problem on an interactive white board or other interactive white board space, and ask the class to share their thinking, recording the student work onto the interactive white board. The following examples include excerpts from the Mathematics Framework.
Math Talks, Transitional Kindergarten Through Grade Two
Several types of math talks are appropriate for transitional kindergarten through grade two (TK–2). Some possibilities include the following:
- Dot talks: A collection of dots is projected briefly (just for a few seconds), and students explain how many they saw and the method they used for counting the dots.
- Ten-frame pictures: An image of a partially filled 10-frame is projected briefly, and students explain various methods they used to figure out the quantity shown in the 10 frames.
- Calculation problems: Written in horizontal format, either an addition or subtraction problem is presented, involving numbers that are appropriate for the students’ current understanding. Presenting problems in horizontal format increases the likelihood that students will think strategically rather than limit their thinking to an algorithmic approach. For example, first graders might solve 7 + ? = 11 by thinking “7 + 3 = 10, and 1 more makes 11.” Second graders subtract two-digit numbers. To solve 54 − 25 mentally, they can think about 54 − 20 = 34, and then subtract the 5 ones, finding 34 − 5 = 29.
Math Talks, Grades Three Through Five
Math talks in grades three through five can strengthen, support, and extend place value understanding, calculation strategies, and fraction concepts.
Some examples of problem types might include the following:
- Students can perform multiplication calculations using known facts and place value understanding and apply properties to solve a two-digit by one-digit problem. For example, if students know that 6 × 10 = 60 and 6 × 4 = 24, they can calculate 6 × 14 = 84 mentally. Presenting such calculation problems in horizontal format increases the likelihood that students will think strategically rather than limit their thinking to an algorithmic approach.
- Students can use relational thinking to consider whether 42 + 19 is greater than, less than, or equal to 44 + 17, and explain their strategies.
- Asking students to order several fractions mentally encourages the use of strategies, such as common numerators and benchmark fractions. For example, students can arrange in order, least to greatest, and explain how they know: 4/5, 1/3, 4/8.
Math Talks, Grades Six Through Eight
In grades six through eight, math talks can include a focus on order of operations, and involve irrational numbers, as well as percents and decimals.
Some examples of problem types for Math Talks at the grades six through eight level might include the following:
- Order of operation calculations allow students to apply properties to help simplify complicated numerical expressions. For example, 3(7 – 2)2 + 8 ÷ 4 – 6 × 5.
- Operations involving irrational numbers to ask the following questions: “2/3 of pi is approximately how much?” and “Four times sqrt(8) is closest to which integer?”
- Percent and decimal problems, reflecting on the following questions: “What is 45 percent of 80?,” “Calculate the percent increase from 80 to 100,” or “0.2 percent of 1,000 is how much?”
Math Talks, Grades Nine Through Twelve
Math talks in grades nine through twelve can strengthen, support, and extend algebraic simplification strategies involving expressions, connect algebra concepts to geometry, and provide opportunities to practice estimation of answers. Also, many math talks from grades six through eight (see previous section) are still readily applicable in grades nine through twelve, as they can lay valuable groundwork for algebraic understanding. For example, strategies that make use of place value and expanded form of multiplication problems, such as 134 × 36, can be employed to understand multiplication of binomials.
Some examples of math talks appropriate for grade nine and upwards include the following:
- Which graph doesn’t belong? Various collections of graphs could be used, where all but one graph agree on various characteristics. The ensuing conversations help students attend to precision in the graphs and with their language (SMP.6) as they talk out the underlying causes of the differences between the graphs. For example, four graphs of polynomial functions could be displayed, with three odd-degree polynomial and one even-degree polynomial, which can highlight the notion of how the terms even and odd are used with regard to polynomials. Another example could be where one function displayed has multiple real roots, while the others have single or no real roots.
- Rewrite expressions using radical notation. There are often multiple approaches to simplifying expressions, so these can serve as excellent discussion points for students to see a variety of ways to approach simplification.
- Similarly, there is merit in sharing and discussing the myriad of ways to approach multiplying monomials, binomials, and trinomials, e.g., (x + y)(3x – 2y), including algebraic properties, such as the distributive property and generic rectangles.
Math Talk Resources
Some additional math talk resources include, but are not limited to, the following:
- San Francisco Unified School District has compiled a comprehensive page of resources for using Number Talks (Math Talks).1
- Inside Mathematics includes video examples of number talks (math talks) from classrooms, grade one through grade seven.2
Data Talks, Grades Transitional Kindergarten Through Twelve
Like “math talks,” data talks offer a short pedagogical routine to help students develop data literacy. Instead of sharing a number problem, teachers can show a data visualization and ask students open questions such as “What do you notice?” or “What do you wonder?” or “What is going on in this data visualization?” Students can be engaged with real data from the world, and it is an ideal opportunity to help develop awareness of social justice issues. Teachers can encourage student noticing and questions, without needing to have knowledge of the topic of the data visualization. The idea of a data talk was inspired by a New York Times weekly section called, “What’s Going on in this Graph?” in collaboration with the American Statistical Association. If teachers cannot answer student questions, they can model the important practice of being comfortable with uncertainty and being curious to find out more. The New York Times data visualizations are mainly suitable for students in middle school and older grades.
Data Talk Resources
- The New York Times provides various visualizations of real data that educators and students can discuss to foster a mathematics discourse.3
- Educators can use various visualizations featured on the Slow Reveal Graphs website to facilitate discourse about data and their implications.4
Sources
[1] SFUSD: Math Talks Resources https://www.sfusd.edu/departments/mathematics-department-page/math-teaching-toolkit/math-teaching-strategies/signature-strategies/math-talks/math-talks-resources)
[2] University of Texas at Austin: Number Talks (https://www.insidemathematics.org/classroom-videos/number-talksematics.org/classroom-videos/number-talks)
[3] The New York Times: What’s Going On in This Graph? (https://www.nytimes.com/column/whats-going-on-in-this-graph)
[4] Slow Reveal Graphs (https://slowrevealgraphs.com/)