Figure 8.1. Progression Chart of Big Ideas, Grades Six Through Eight (Figure 7.4 in the 2023 CA Mathematics Framework)
| Content Connections | Big Ideas: Grade Six | Big Ideas: Grade Seven | Big Ideas: Grade Eight |
|---|---|---|---|
| Reasoning with Data | Variability in data | Visualize populations | Data explorations |
| Reasoning with Data | The shape of distributions | Populations and samples | Data graphs and tables |
| Reasoning with Data | n/a | Probability models | Interpret scatter plots |
| Exploring Changing Quantities | Fraction relationships | Proportional relationships | Multiple representations of functions |
| Exploring Changing Quantities | Patterns inside numbers | Unit rates in the world | Linear equations |
| Exploring Changing Quantities | Generalizing with multiple representations | Graphing relationships | Slopes and intercepts |
| Exploring Changing Quantities | Relationships between variables | Scale Drawings | Interpret scatter plots |
| Taking Wholes Apart, Putting Parts Together | Model the world | Shapes in the world | Cylindrical investigations |
| Taking Wholes Apart, Putting Parts Together | Nets and surface area | 2-D and 3-D connections | Pythagorean explorations |
| Taking Wholes Apart, Putting Parts Together | n/a | Angle relationships | Big and small numbers |
| Discovering Shape and Space | Nets and surface area | Shapes in the world | Shape, number, and expressions |
| Discovering Shape and Space | Distance and direction | 2-D and 3-D connections | Pythagorean explorations |
| Discovering Shape and Space | Graphing shapes | Scale drawings | Cylindrical investigations |
| Discovering Shape and Space | n/a | Angle relationships | Transformational geometry |
As students enter the middle grades, the number sense they acquired in the elementary grades deepens with the content. Students transition from exploring numbers and arithmetic operations in kindergarten through grade five to exploring relationships between numbers (CC2—Exploring Changing Quantities and CC3—Taking Wholes Apart and Putting Parts Together) and making sense of contextual situations using various representations. SMP.2 is especially critical at this stage, as students represent a wide variety of real-world situations through the use of real numbers and variables in expressions, equations, and inequalities. Big Ideas in number sense for the middle grades include the following:
- Number line understanding
- Proportions, ratios, percents, and relationships among these
- Generalized numbers as leading to algebra.
The Big Ideas of data science include the following:
- Data in the world: exploration, interpretation, decision making, ethics
- Variability: describing, displaying, and comparing
- Sampling to understand a population: randomness, bias, how many?
- Are they related? Multivariate thinking
- What are the chances? Probability as the basis for data-based claims
As in earlier grades, students experience data science as a tool to help understand their worlds via a process that begins with wondering questions. This is also the beginning of the mathematical modeling cycle, the statistical and data science exploration process, and investigations in science.
The sixth through eighth grade span is an important time for further development of important mathematical concepts needed for high school. Students are introduced to irrational numbers through investigations using the Pythagorean Theorem. Students work with right triangles and apply their learning to further investigations of plane figures and solids, where the Pythagorean Theorem is useful in finding unknown measures. Students explore cylinders, cones, and spheres, while noticing radius as a useful component of right triangles. Students continue investigating 3-D shapes as they consider these shapes to be made up of slices of 2-D shapes. Students begin their formal study of transformational geometry as the study of shapes that twist, turn, and grow in the plane. Students investigate and make meaning of these transformations as they connect them to similarity and congruence.
The following interview highlights an educator who is using digital tools to help students in this grade span express their thinking and provide feedback and supports as necessary.
Voices from the Field
Martin Joyce | Taylor Middle School | Millbrae, CA
Joyce—a 12-year veteran who currently teaches pre-algebra at Taylor Middle School—leverages technology integration, collaboration, and feedback to engage all of his learners.
Describe some of the challenges that you and your students have experienced with the implementation of distance learning. How have you turned those into opportunities for success?
In terms of success, the most prominent example for me has been around using Desmos—imagine having an interactive PowerPoint with graphs, sketch capabilities, and fantastic feedback options. I’ve been fortunate to be part of their pilot sixth through eighth grade math curriculum. Students get real-time feedback and can use the data to continually revise their work. We can take snapshots of students’ work and use those as models to demonstrate to the entire class. In other words, it’s not just me showing them the successful way to problem solve.
Desmos complements monitoring, selecting, sequencing, and connecting extremely well. I really focus on questions to support those students who may struggle. As I monitor their work in real time, I see what they are doing (sketching) and then identify whose work I want to share. I select and invite participation from diverse learners who may not just volunteer. When it comes to their problem solving, I often start with the most common mistakes or the methods of success.
In terms of challenges, the primary one for me has been around pacing. I think teachers have had to accept that we are often not going to get as much done as we had in years past. I’ve had to continually ask myself reflective questions such as, “What do I skip?” or “Where do I compress?” I’ve really had to allow for more time, and I’ve had to learn to be more patient. I’ve also had to be flexible with when and how students may respond to questions.
Another challenge is that some students don’t participate in places like virtual breakout rooms versus how they might in face-to-face environments. Overall, I think the student discourse has lessened during distance learning. I’ve had to intervene and facilitate more. I’ve had to prompt them more to connect with one another. I’ve had to teach them more communication and collaboration skills.
One small tip I recently picked up is facilitating a Zoom (video conferencing platform) chat waterfall. I ask students to answer a question in the chat box but instruct them to not hit enter until told to do so. I honor time to wait or think and then have them hit enter to create a cascade (a waterfall) of responses all at once. Otherwise, we are influenced by one another’s responses or thoughts.
How do you strike a balance between analog and digital tools or synchronous and asynchronous learning experiences for your students?
This year, our school has scheduled asynchronous time Tuesday through Friday, 1:30–3 p.m. Our classes are 80 minutes long. Students have three of these classes per day. We created the asynchronous opportunities to address the amount of screen time and to develop independence. We have used this time for office hours focused on intervention and support. For math, I take the practice problems and do a screencast recording for these asynchronous times. Although there are plenty of great YouTube tutorial videos for math, I think it’s valuable for students to have access to videos I create.
Synchronous time for me is focused on instruction and students working with me in real time. I use warm-ups to activate prior knowledge, we do some problems together with discussion, and then we have lesson synthesis after all of the activities. I have started to incorporate cool-downs or exit tickets. I use one or two problems for quick formative assessments.
How are you using technology to help students build foundational algebra skills and understand key concepts?
Desmos and game-like applications are helpful. Technology allows students to see these math principles in concrete representations. It allows them to visualize. They can try things and see if they are right or wrong. This works well with both horizontal and vertical number lines.
In eighth grade, we work with ratios and the slope of a graph. Desmos would be the key here for the graphing. Google Sheets (collaborative online spreadsheets) work well for the percentages and two-way tables.
I have a year-end project on the Pythagorean Theorem, which has traditionally been challenging for students who have been absent. I now use Edpuzzle (video-based lessons) to record myself and share videos on how they can get started. It’s great to voice over (audio record) my instruction and demonstrations.
What are your main priorities or concerns when selecting technology for your classes?
My primary considerations are both access and ease of use. I’m really starting to think that less is more when it comes to educational technology. I like to have a baseline app or an interface that I can use. It can’t always be about adding an entirely new thing.
For example, Flipgrid (video-based discussion software) is a great add-on, and it works extremely well with Desmos. It’s easy to use, and it creates opportunities for student voice. I use it from the first days of school, where students record themselves demonstrating the correct pronunciation of their name, as well as throughout the year for demonstrations of mastery. I will still use Desmos for the assessment, but if a student wants to increase their score, they can record themselves in Flipgrid discussing their mistakes and how to arrive at the right answer. I want them to convince me what they know now and didn’t know before. It doesn’t matter when one knows it, just that one knows it. I want to value the work and the learning.
I’ve really found HyperDocs (digital lesson plans) to be especially helpful during distance learning and think it will continue to have significant value as we return to face-to-face. It really gives students a structure to follow when doing a multi-step project.
There are a lot of great tools out there, but I don’t want to overwhelm my students with too many. I think teachers need to be more careful and intentional with introducing new technologies. I try to have a core application with a couple great add-ons.
Grade Six
Proportional reasoning, unit rates, and generalizing relationships are central to sixth grade. This represents a major shift for students and is worthy of deep, sustained attention. Students build new ways to represent the world symbolically, on the number line, and through data that add nuance to the mathematical terrain. In sixth grade, students are introduced to the concepts of ratios and unit rates, and they use tables of equivalent ratios, double number lines, tape diagrams, and equations to solve real-world problems. A critical feature to emphasize for students is the ability to think multiplicatively, as well as additively.
Students are often introduced to the idea of a variable, not through the concept of variation, but through exercises that ask them to find a missing number that is represented by x or another variable. Unfortunately, this gives them the idea that a variable stands for a single number, rather than something that varies––which causes students problems when they later need to learn about functions and other uses of algebra where a variable varies. The best way to introduce students to the idea of a variable is to give them examples of pattern growth that they can analyze, represent in words, and eventually as variables. The Path problem—finding how many squares are in the path that borders different sized squares—is an ideal way to introduce the concept of a variable.1 Ideas of equivalence and operations, laid before in earlier grades, now take on new meaning, as students apply properties of operations to generate equivalent expressions and identify when two expressions are equivalent.
Sixth-grade students engage in data investigations to help them understand variability. If they are given opportunities to develop curiosity and ask questions about the world, they can collect and analyze data, determine and confirm results, and represent findings with different representations. Teachers can ask students to collect data and/or bring in real data sets from the world that students are invited to investigate. The Common Online Data Analysis Platform (CODAP) is a website providing free educational software for data analysis. CODAP is an ideal tool for introducing students to data exploration. CODAP includes many interesting data sets and lessons, and students can look visually at the shape of data distributions, leading to consideration of measures of center and variability.2
Students in grade six also develop new ways to compose and decompose with 2-D and 3-D shapes, thinking about volume and area as additive and using nets to explore the surfaces that create solids. Moving from 3-D solids to 2-D representations of 3-D solids is a topic where students explore, construct, and take apart, building with unit cubes and drawing representations. In a virtual environment, students can use a CAD, Tinkercad, or other programs to design and build complex shapes. While they are building 3-D representations in a 2-D space, it is important to ask students to think about what makes their 2-D drawings appear to be 3-D. Shapes in this environment may appear to be a parallelogram or a rhombus when they are representing a 3-D object—what the shape of the face really is in 3-D space is a square. Asking students to build their CAD designs out of cardboard or paper is a good way to have them explore the way shapes look when they change the angle of their view. Students in grade six also learn about absolute value. An ideal opportunity to learn absolute value is an exploration of the shapes on a four-quadrant coordinate grid, with absolute value used as a measure of distance, while integer coordinates represent the vertices of the shapes.
Students who are ELs are encouraged to use their developing English and native language assets (e.g., cognates, morphological awareness) and draw on their prior knowledge. Teachers can examine text and tasks for key language forms and structures, and general as well as discipline-specific, high-utility academic vocabulary words linked to the Big Ideas and connections. Teachers can provide purposeful scaffolds and supports to engage EL students in sustained mathematical discourse in multiple contexts to build academic language and knowledge. Planned and “just-in-time” scaffolds and supports provide multiple entry points for meaning making and sharing of ideas in mathematical ways and include representations, expression starters and builders, and targeted and high-utility academic vocabulary and language structures (e.g., problems, explanations, arguments, descriptions). Teachers guide deconstruction and/or co-construction of problems, investigations, arguments, explanations, descriptions, and connections.
Critical Areas of Instructional Focus for Grade Six
Figure 8.2. Grade Six Big Ideas (Figure 7.7 in the 2023 CA Mathematics Framework)
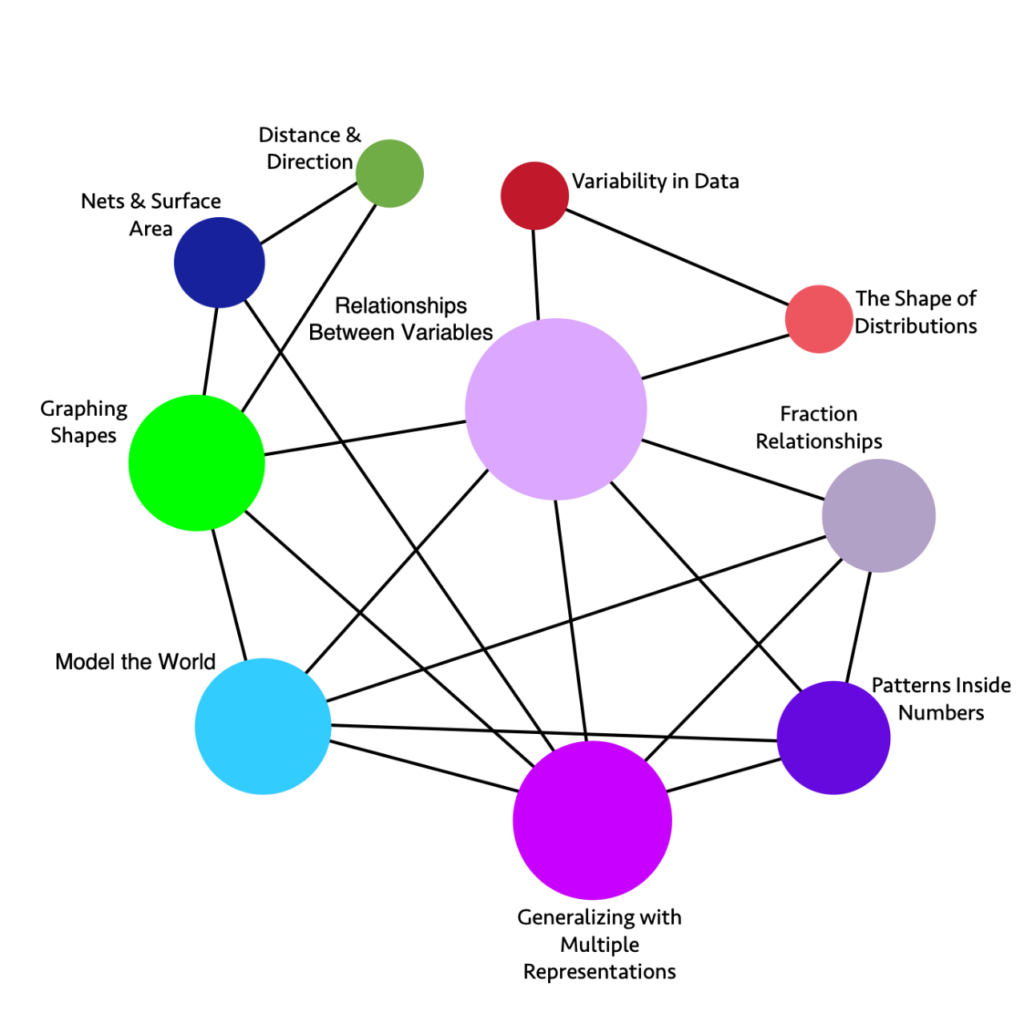
Long description: The graphic illustrates the connections and relationships of some sixth-grade mathematics concepts.
Direct connections include:
- Variability in Data directly connects to: The Shape of Distributions, Relationships Between Variables
- The Shape of Distributions directly connects to: Relationships Between Variables, Variability in Data
- Fraction Relationships directly connects to: Patterns Inside Numbers, Generalizing with Multiple Representations, Model the World, Relationships Between Variables
- Patterns Inside Numbers directly connects to: Fraction Relationships, Generalizing with Multiple Representations, Model the World, Relationships Between Variables
- Generalizing with Multiple Representations directly connects to: Patterns Inside Numbers, Fraction Relationships, Model the World, Relationships Between Variables, Nets and Surface Area, Graphing Shapes
- Model the World directly connects to: Fraction Relationships, Relationships Between Variables, Patterns Inside Numbers, Generalizing with Multiple Representations, Graphing Shapes
- Graphing Shapes directly connects to: Model the World, Generalizing with Multiple Representations, Relationships Between Variables, Distance and Direction, Nets and Surface
- Nets and Surface directly connects to: Graphing Shapes, Generalizing with Multiple Representations, Distance and Direction
- Distance and Direction directly connects to: Graphing Shapes, Nets and Surface Area
- Relationships Between Variables directly connects to: Variability in Data, The Shape of Distributions, Fraction Relationships, Patterns Inside Numbers, Generalizing with Multiple Representations, Model the World, Graphing Shapes
Figure 8.2a.Grade Six Big Ideas, Content Connections, and Content Standards (Figure 7.8 in the 2023 CA Mathematics Framework)
| Big Ideas | Content Connections | Grade Six Content Standards |
|---|---|---|
| Variability in Data | Reasoning with Data | SP.1, SP.5, SP.4: Investigate real world data sources, ask questions of data, start to understand variability––within data sets and across different forms of data, consider different types of data, and represent data with different representations. |
| The Shape of Distributions | Reasoning with Data | SP.2, SP.3, SP.5: Consider the distribution of data sets––look at their shape and consider measures of center and variability to describe the data and the situation which is being investigated. |
| Fraction Relationships | Exploring Changing Quantities | NS.1, RP.1, RP.3: Understand fractions divided by fractions, thinking about them in different ways (e.g., how many 1/3 are inside 2/3?), considering the relationship between the numerator and denominator, using different strategies and visuals. Relate fractions to ratios and percentages. |
| Patterns inside Numbers | Exploring Changing Quantities | NS.4, RP.3: Consider how numbers are made up, exploring factors and multiples, visually and numerically. |
| Generalizing with Multiple Representations | Exploring Changing Quantities | EE.6, EE.2, EE.7, EE.3, EE.4, RP.1, RP.2, RP.3: Generalize from growth or decay patterns, leading to an understanding of variables. Understand that a variable can represent a changing quantity or an unknown number. Analyze a mathematical situation that can be seen and solved in different ways and that leads to multiple representations and equivalent expressions. Where appropriate in solving problems, use unit rates. |
| Relationships Between Variables | Exploring Changing Quantities | EE.9, EE.5, RP.1, RP.2, RP.3, NS.8, SP.1, SP.2: Use independent and dependent variables to represent how a situation changes over time, recognizing unit rates when it is a linear relationship. Illustrate the relationship using tables, four quadrant graphs and equations, and understand the relationships between the different representations and what each one communicates. |
| Model the World | Taking Wholes Apart, Putting Parts Together | NS.3, NS.2, NS.8, RP.1, RP.2, RP.3: Solve and model real world problems. Add, subtract, multiply, and divide multi-digit numbers and decimals, in real-world and mathematical problems––with sense making and understanding, using visual models and algorithms. |
| Nets and Surface Area | Taking Wholes Apart, Putting Parts Together and Discovering Shape and Space |
EE.1, EE.2, G.4, G.1, G.2, G.3: Build and decompose 3-D figures using nets to find surface area. Represent volume and area as expressions involving whole number exponents. |
| Distance and Direction | Discovering Shape and Space | NS.5, NS.6, NS.7, G.1, G.2, G.3, G.4: Students experience absolute value on numbers lines and relate it to distance, describing relationships, such as order between numbers using inequality statements. |
| Graphing Shapes | Discovering Shape and Space | G.3, G.1, G.4, NS.8, EE.2: Use coordinates to represent the vertices of polygons, graph the shapes on the coordinate plane, and determine side lengths, perimeter, and area. |
Grade Seven
A Big Idea for seventh grade is proportional relationships, which students experience in many different ways as they consider fractions, decimals, percents, and integers. An important idea for students is that every fraction, decimal, percent, integer, and whole number can be written as a rational number defined to be the ratio of two integers and understandings of fractions, decimals, percents, integers, and whole numbers can all be subsumed into a larger understanding of rational numbers. This unified understanding is achieved, in part, through students’ use of number lines to represent operations on rational numbers, such as the addition and subtraction of rational numbers on a number line. Students can be introduced to a host of representations as they reason through proportional situations: graphs, equations, verbal descriptions, tables, charts, and double number lines. There are many approaches to solving proportions, and it is important to emphasize that sense-making is more important than answer finding.
Students in seventh grade should continue investigations that involve generalization, allowing them to see and use algebra as a useful problem-solving tool.
A Big Idea in the Reasoning with Data strand is variability, and understanding variability is at the heart of data literacy. When working with visualizations of data, students consider not only the most popular value in a dataset (the mode) but also describe the shape and spread of data distributions. As they engage in experiences where they produce their own data through measurement, teachers can highlight for students the variation that results. For example, if students plant a particular variety of flower seed at multiple locations around the school, then measure the plants’ height and the amount of sunlight each month, they can conduct investigations into the ways plant growth and sunlight relate to each other. They discuss and describe any patterns in their bivariate data and reasons for the variability. Finally, students consider their own measurement techniques and how confident they are that they all measured the same way (so that if someone else measured, they would get the same height or sunlight). Students can be invited to study populations by taking random samples and determining if the samples accurately represent the population, considering issues of bias and ethics. They can use classroom simulations and computer software to model repeated sampling, analyzing the variation in results. Students can also use measures of center and variability to draw comparative inferences about populations, considering what the visual plots show.
New ideas for grade seven are randomness, probability, and uncertainty. At this point, students can begin to conceive of probability as a measure of the chance that something will happen, seeing it as a basic measure of certainty or uncertainty. They can learn to use sample spaces, lists, tables, and tree diagrams.
Students connect proportional relationships to the 2-D and 3-D world through the construction of scale figures. Students investigate angles and connections between angles, including supplementary and complementary angles, noticing that increasing one decreases the other.
Students solve problems involving solid figures and develop intuition about 2-D slices of 3-D figures. The idea of sliced objects and the shape produced, as well as measure and area, is important to the further study of mathematics in higher education. Students can be using technology to support their calculations as they are building understanding of the physical shapes. In a virtual environment, students can use a CAD, Tinkercad, or other program to design and build complex shapes. While they are building 3-D representations in a 2-D space, it is important to ask students to think about what makes their 2-D drawings appear to be 3-D. Shapes in this environment may appear to be a parallelogram or a rhombus when they are representing a 3-D object—what the shape of the face really is in 3-D space is a square. Asking students to build their CAD designs out of cardboard or paper is a good way to have them explore the way shapes look when they change the angle of their view.
Measurements that include decimal and fraction numbers can be used throughout their investigations. When considering physical objects and quantifying the objects using measures, students are supported in building important connections between visual models and numbers.
Students who are ELs are encouraged to use their developing English and native language assets (e.g., cognates, morphological awareness) and draw on their prior knowledge. Teachers can examine text and tasks for key language forms and structures, and general as well as discipline-specific, high-utility academic vocabulary words linked to the Big Ideas and connections. Teachers can provide purposeful scaffolds and supports to engage EL students in sustained mathematical discourse in multiple contexts to build academic language and knowledge. Planned and “just-in-time” scaffolds and supports provide multiple entry points for meaning making and sharing of ideas in mathematical ways and include representations, expression starters and builders, and targeted and high-utility academic vocabulary and language structures (e.g., problems, explanations, arguments, descriptions, and connections). Teachers guide deconstruction and/or co-construction of problems, investigations, arguments, explanations, descriptions, and connections. Clear and precise expressions, as well as cohesive writing, support stronger communication of mathematical concepts and practices.
Critical Areas of Instructional Focus for Grade Seven
Figure 8.3 Grade Seven Big Ideas (Figure 7.9 in the 2023 CA Mathematics Framework)
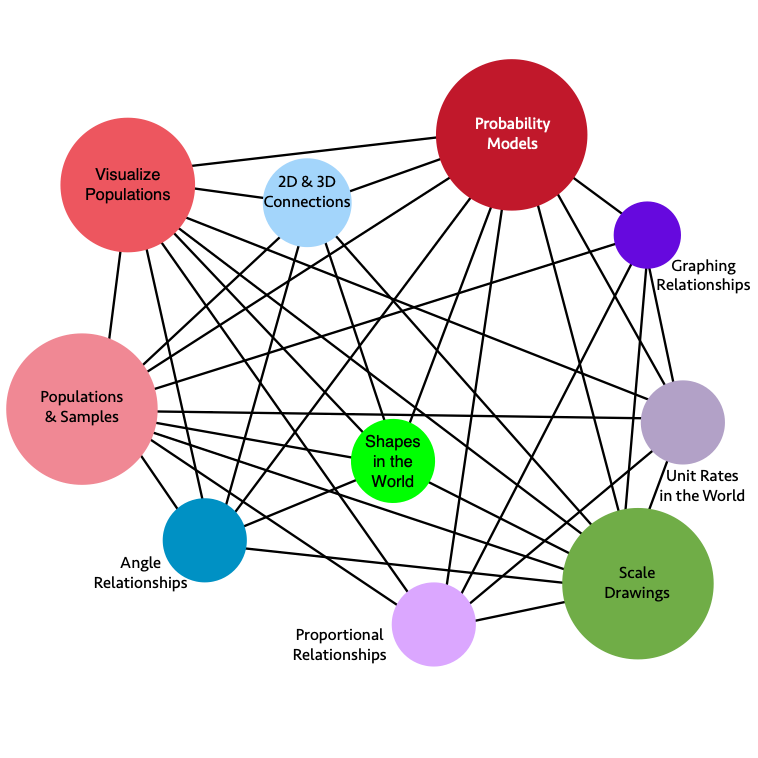
Long description: The graphic illustrates the connections and relationships of some seventh-grade mathematics concepts.
Direct connections include:
- Angle Relationships directly connects to: Scale Drawings, 2-D and 3-D Connections, Populations and Samples, Proportional Relationships, Shapes in the World, Visualize Populations, Probability Models
- Scale Drawings directly connects to: 2-D and 3-D Connections, Graphing Relationships, Populations and Samples, Unit Rates in the World, Proportional Relationships, Visualize Populations, Probability Models, Angle Relationships
- Graphing Relationships directly connects to: Populations and Samples, Unit Rates in the World, Proportional Relationships, Probability Models, Scale Drawings
- 2-D and 3-D Connections directly connects to: Scale Drawings, Angle Relationships, Probability Models, Proportional Relationships, Visualize Populations, Shapes in the World, Populations and Samples
- Populations and Samples directly connects to: 2-D and 3-D Connections, Scale Drawings, Angle Relationships, Probability Models, Proportional Relationships, Visualize Populations, Shapes in the World, Unit Rates in the World, Graphing Relationships
- Unit Rates in the World directly connects to: Populations and Samples, Graphing Relationships, Scale Drawings, Proportional Relationships, Probability Models, Visualize Populations
- Shapes in the World directly connects to: Populations and Samples, 2-D and 3-D Connections, Proportional Relationships, Scale Drawings, Angle Relationships, Probability Models, Visualize Populations
- Visualize Populations directly connects to: 2-D and 3-D Connections, Scale Drawings, Angle Relationships, Probability Models, Proportional Relationships, Populations and Samples, Shapes in the World, Unit Rates in the World
- Probability Models directly connects to: 2-D and 3-D Connections, Scale Drawings, Angle Relationships, Proportional Relationships, Visualize Populations, Shapes in the World, Unit Rates in the World, Graphing Relationships, Populations and Samples
- Proportional Relationships directly connects to: 2-D and 3-D Connections, Scale Drawings, Angle Relationships, Probability Models, Populations and Samples, Visualize Populations, Shapes in the World, Unit Rates in the World, Graphing Relationships
Figure 8.3a. Grade Seven Big Ideas, Content Connections, and Content Standards (Figure 7.10 in the 2023 CA Mathematics Framework)
| Big Ideas | Content Connections | Grade Seven Content Standards |
|---|---|---|
| Populations and Samples | Reasoning with Data | SP.1, SP.2, RP.1, RP.2, RP.3, NS.1, NS.2, NS.3, EE.3: Study a population by taking random samples and determine if the samples accurately represent the population.
|
| Visualize Populations | Reasoning with Data | SP.3, SP.4, NS.1, NS.2, NS.3, EE.3: Draw comparative inferences about populations––consider what visual plots show, and use measures of center and variability
|
| Probability Models | Reasoning with Data | SP.5, SP.6, SP.7, SP.8, RP.1, RP.2, RP.3, NS.1, NS.2, NS.3, EE.3: Develop a probability model and use it to find probabilities of events and compound events, representing sample spaces and using lists, tables, and tree diagrams.
|
| Proportional Relationships | Exploring Changing Quantities | EE.2, EE.3, RP.1, RP.2, RP.3: Explore, understand, and use proportional relationships––using fractions, graphs, and tables. |
| Unit Rates in the World | Exploring Changing Quantities | RP.1, RP.2, RP.3, EE.1, EE.2, EE.3, EE.4: Solve real world problems using equations and inequalities, and recognize the unit rate within representations. |
| Graphing Relationships | Exploring Changing Quantities | EE.4, RP.1, RP.2, RP.3: Solve problems involving proportional relationships that can lead to graphing using geometry software and making sense of solutions. |
| 2-D and 3-D Connections | Taking Wholes Apart, Putting Parts Together and Discovering Shape and Space |
G.1, G.2, G.3, NS.1, NS.2, NS.3: Draw and construct shapes, slice 3-D figures to see the 2-D shapes. Compare and classify the figures and shapes using area, surface area, volume, and geometric classifications for triangles, polygons, and angles. Make sure to measure with fractions and decimals, using technology for calculations. |
| Angle Relationships | Taking Wholes Apart, Putting Parts Together and Discovering Shape and Space |
G.5, G.6, NS.1, NS.2, NS.3: Explore relationships between different angles, including complementary, supplementary, vertical, and adjacent, recognizing the relationships as the measures change. For example, angles A and B are complementary. As the measure of angle, A increases, the measure of angle B decreases. |
| Scale Drawings | Discovering Shape and Space and Exploring Changing Quantities |
G.1, EE.2, EE.3, EE.4, NS.2, NS.3, RP.1, RP.2, RP.3: Solve problems involving scale drawings and construct geometric figures using unit rates to accurately represent real world figures. (Use technology for drawing). |
| Shapes in the World | Discovering Shape and Space and Exploring Changing Quantities |
G.1, G.2, G.3, G.4, G.5, G.6, NS.1, NS.2, NS.3: Solve real life problems involving triangles, quadrilaterals, polygons, cubes, right prisms, and circles using angle measures, area, surface area, and volume. |
Grade Eight
In eighth grade, students’ understanding of rational numbers is extended in two important ways. First, rational numbers have decimal expansions, which eventually repeat, and vice versa. All numbers with decimal expansions, which eventually repeat, are rational numbers. A typical task to demonstrate the first aspect of this standard is to ask students to investigate long division with a calculator, or other technology, to demonstrate that 3/11 has a repeating decimal expansion, and to explain why. As students realize the connection between the remainder and the repeating portion, their understanding of rational numbers can fully integrate with their understanding of decimals and place value.
Second, as students begin to recognize that there are numbers that are not rational, which are called irrational numbers, they can see that these new types of numbers can still be located on the number line and can also be approximated by rational numbers. The foundation for this recognition is actually built through seventh-grade geometry explorations of the relationship between the circumference and diameter of a circle, and formalized into the formula for circumference, where the division of the circumference by the diameter for a given circle always results in a number a little larger than three, irrespective of the size of the circle. In exploring this quotient of circumference by diameter, students get a look at a decimal approximation for their first irrational number, pi. In eighth grade, the notation for numbers expands greatly, with the introduction of integer exponents and radicals to represent solutions of equations. Number sense plays a critical role in eighth grade, as students can check the accuracy of their answers with estimation. They can also use technological tools to work with place value and to express large and small numbers in scientific notation.
Proportional relationships continue to be a hub of mathematical thought in eighth grade, serving as a tool for thinking about patterns of growth, functions, and geometric transformations. Functions are an important addition to the algebraic space in eighth grade. One Big Idea that challenges students’ notions of clean, linear relationships, after all their work on functions and proportions, is the idea of extracting meaning from data. Data in the real world is rarely neat and lock-step; this is an important moment to develop a lens for looking at scatter plots and genuinely asking what relationships can be found.
Eighth grade students conduct data investigations that allow them to interpret bivariate and multivariate data. They also continue to visualize and represent single-variable data with dot plots, histograms, and box plots; use measures of center and spread to describe such distributions; and compare distributions from different populations or samples using these representations and statistics. Students also construct scatter plots, which show an association between two variables that is visually identifiable. Fitting a function to the data is the creation of a mathematical model. This work begins in eighth grade with visual fitting of a linear model. While the type of function that is used most frequently is a line (a linear function), students also need experiences with plotting associations that are clearly non-linear, as well as experimenting with fitting other types of functions (quadratic, exponential).
Any standard data software (including spreadsheets, Desmos, Geogebra, CODAP) will fit lines, quadratic functions, and exponential functions to given data. Students have experiences fitting lines and some other functions visually (by adjusting parameters on appropriate function types in graphing software) and using appropriate software tools, which perform the regression behind the scenes.
In grade eight, students are introduced to irrational numbers through the study of circles, spheres, and other solids that have a circle as a base. Students investigate the relationships between the side lengths of right triangles and use the Pythagorean Theorem to find a missing side length when two others are known. When studying quadrilaterals and using the Pythagorean Theorem, students can consider rectangles and squares with whole number side lengths and investigate which rectangles have diagonals with irrational side lengths. Students connect their understanding of right triangles and the Pythagorean Theorem to solids where they can use this knowledge to determine distances between two points. Students continue their study of 2-D shapes as they learn to move them across a plane, using transformations to investigate similarity and congruence. This initial journey into slides, rotations, reflections, and dilations is intended to be an initial introduction and should include the use of a dynamic geometric software.
Students who are ELs are encouraged to use their developing English and native language assets (e.g., cognates, morphological awareness) and draw on their prior knowledge. Teachers can examine text and tasks for key language forms and structures, and general as well as discipline-specific, high-utility academic vocabulary words linked to the Big Ideas and connections. Teachers can provide purposeful scaffolds and supports to engage EL students in sustained mathematical discourse in multiple contexts to build academic language and knowledge. Planned and “just-in-time” scaffolds and supports provide multiple entry points for meaning making and sharing of ideas in mathematical ways and include representations, expression starters and builders, and targeted and high-utility academic vocabulary and language structures (e.g., problems, explanations, arguments, descriptions, and connections). Teachers guide deconstruction and/or co-construction of problems, investigations, arguments, explanations, descriptions, and procedures. Clear and precise expressions, as well as cohesive writing, support stronger communication of mathematical concepts and practices.
Critical Areas of Instructional Focus for Grade Eight
Figure 8.4. Grade Eight Big Ideas (Figure 7.11 in the 2023 CA Mathematics Framework)
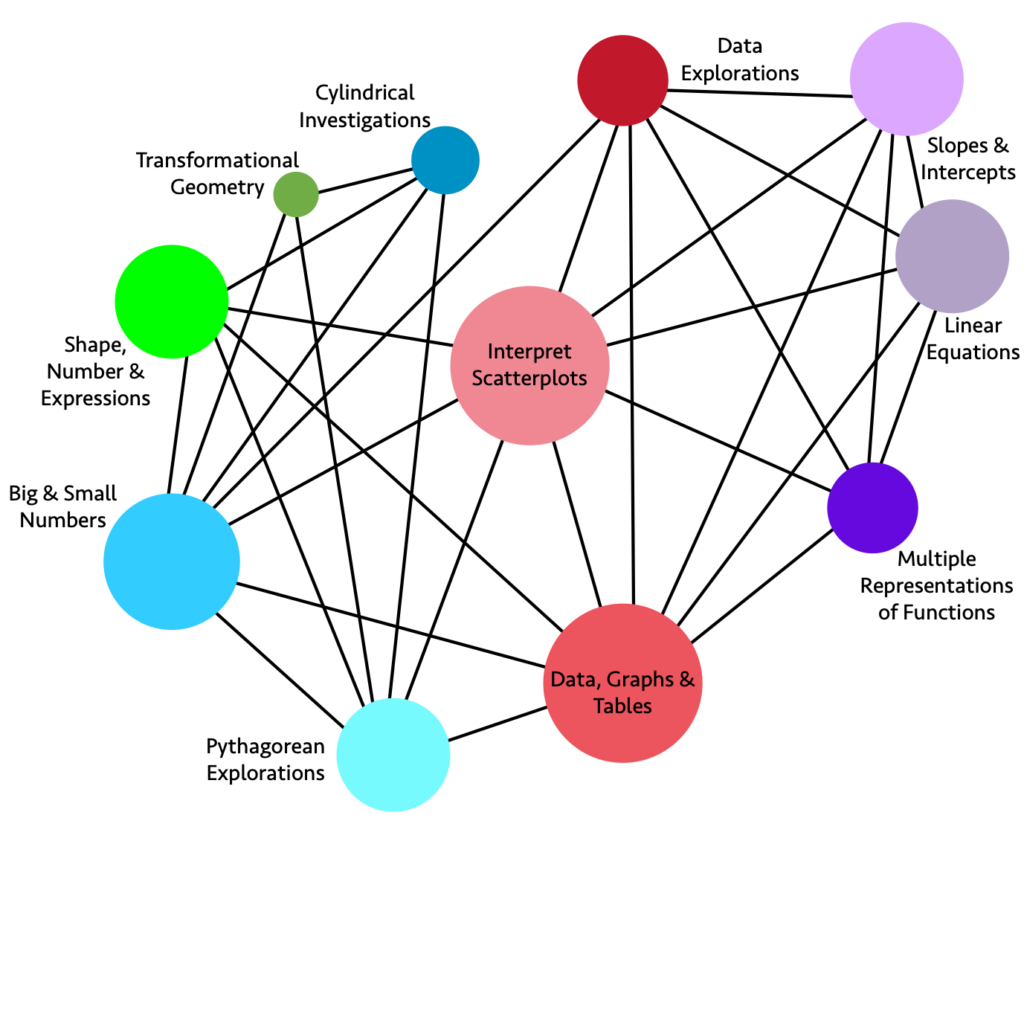
Long description: The graphic illustrates the connections and relationships of some eighth-grade mathematics concepts.
Direct connections include:
- Data Explorations directly connects to: Slopes and Intercepts, Linear Equations, Multiple Representations of Functions, Data Graphs and Tables, Interpret Scatter plots, Big and Small Numbers
- Slopes and Intercepts directly connects to: Linear Equations, Multiple Representations of Functions, Data Graphs and Tables, Interpret Scatter plots, Data Explorations
- Linear Equations directly connects to: Slopes and Intercepts, Data Explorations, Multiple Representations of Functions, Data Graphs and Tables, Interpret Scatter plots
- Multiple Representations of Functions directly connects to: Data Graphs and Tables, Interpret Scatter plots, Data Explorations, Slopes and Intercepts, Linear Equations
- Data Graphs and Tables directly connects to: Multiple Representations of Functions, Linear Equations, Slopes and Intercepts, Data Explorations, Interpret Scatter plots, Shape Number and Expressions, Big and Small Numbers, Pythagorean Explorations
- Pythagorean Explorations directly connects to: Data Graphs and Tables, Interpret Scatter plots, Cylindrical Investigations, Transformational Geometry, Shape Number and Expressions, Big and Small Numbers
- Big and Small Numbers directly connects to: Pythagorean Explorations, Data Graphs and Tables, Interpret Scatter plots, Data Explorations, Cylindrical Investigations, Transformational Geometry, Shape Number and Expressions
- Shape Number and Expressions directly connects to: Big and Small Numbers, Pythagorean Explorations, Data Graphs and Tables, Interpret Scatter plots, Cylindrical Investigations
- Transformational Geometry directly connects to: Big and Small Numbers, Pythagorean Explorations, Cylindrical Investigations
- Cylindrical Investigations directly connects to: Big and Small Numbers, Pythagorean Explorations, Shape Number and Expressions, Transformational Geometry
- Interpret Scatter plots directly connects to: Data Explorations, Slopes and Intercepts, Linear Equations, Multiple Representations of Functions, Data Graphs and Tables, Pythagorean Explorations, Big and Small Numbers, Shape Number and Expressions
Figure 8.4a. Grade Eight Big Ideas, Content Connections, and Content Standards (Figure 7.12 in the 2023 CA Mathematics Framework)
| Big Ideas | Content Connections | Grade Eight Content Standards |
|---|---|---|
| Interpret Scatter Plots | Reasoning with Data and Exploring Changing Quantities |
SP.1, SP.2, SP.3, EE.2, EE.5, F.1, F.2, F.3: Construct and interpret data visualizations, including scatter plots for bivariate measurement data using two-way tables. Describe patterns noting whether the data appear in clusters, are linear or nonlinear, whether there are outliers, and if the association is negative or positive. Interpret the trend(s) in change of the data points over time. |
| Data, Graphs and Tables | Reasoning with Data | SP.3, SP.4, EE.2, EE.5, F.3, F.4, F.5: Construct graphs of relationships between two variables (bivariate data), displaying frequencies and relative frequencies in a two-way table.
|
| Data Explorations | Reasoning with Data | SP.1, SP.2, SP.3, SP.4, EE.4, EE.5, F.1, F.2, F.3, F.4, F.5: Conduct data explorations, such as the consideration of seafloor spreading, involving large data sets and numbers expressed in scientific notation, including integer exponents for large and small numbers using technology.
|
| Linear Equations | Exploring Changing Quantities | EE.5, EE.7, EE.8, F.2, F.4, F.5: Analyze slope and intercepts and solve linear equations including pairs of simultaneous linear equations through graphing and tables and using technology. |
| Multiple Representations of Functions | Exploring Changing Quantities | EE.5, EE.6, EE.7: Move between different representations of linear functions (i.e., equation, graph, table, and context), sketch and analyze graphs, use similar triangles to visualize slope and rate of change with equations containing rational number coefficients. |
| Slopes and Intercepts | Exploring Changing Quantities | EE.5, SP.1, SP.2, SP.3: Construct graphs using bivariate data, comparing the meaning of parallel and non-parallel slopes with the same or different y-intercepts using technology. |
| Cylindrical Investigations | Taking Wholes Apart, Putting Parts Together and Discovering Shape and Space |
G.9, G.6, G.7, G.8, NS.1, NS.2: Solve real world problems with cylinders, cones, and spheres. Connect volume and surface area solutions to the structure of the figures themselves (e.g., why and how is the area of a circle formula used to find the volume of a cylinder?). Show visual proofs of these relationships, through modeling, building, and using computer software. |
| Pythagorean Explorations | Taking Wholes Apart, Putting Parts Together and Discovering Shape and Space |
G.7, G.8, NS.1, NS.2, EE.1, EE.2: Conduct investigations in the coordinate plane with right triangles to show that the areas of the squares of each leg combine to create the square of the hypotenuse and name this as the Pythagorean Theorem. Using technology, use the Pythagorean Theorem to solve real world problems that include irrational numbers. |
| Big and Small Numbers | Taking Wholes Apart, Putting Parts Together | EE.1, EE.2, EE.3, EE.4, NS.1, NS.2: Use scientific notation to investigate problems that include measurements of very large and very small numbers. Develop number sense with integer exponents (e.g., 1/27 = 1/33 = 3-3). |
| Shape, Number and Expressions | Discovering Shape and Space | G.9, G.6, G.7, G.8, EE.1, EE.2, NS.1, NS.2: Compare shapes containing circular measures to prisms. Note that cubes and squares represent unit measures for volume and surface area. See and use the connections between integer exponents and area and volume. |
| Transformational Geometry | Discovering Shape and Space | G.1, G.2, G.3, G.4, G.5, G.6, G.7, G.8: Plot 2-D figures on a coordinate plane, using geometry software, noting similarity when dilations are performed and the corresponding angle measures maintain congruence. Perform translations, rotations, and reflections and notice when shapes maintain congruence. |
Sources
[1] YouCubed: Border-Problem (https://www.youcubed.org/wp-content/uploads/2018/09/Border-Problem-final-copy.pdf)
[2] Common Online Data Analysis Platform (CODAP) (https://codap.concord.org/)