Figure 7.1. A Progression Chart of Big Ideas through Grades 3–5
| Content Connections | Big Ideas: Grade 3 | Big Ideas: Grade 4 | Big Ideas: Grade 5 |
|---|---|---|---|
| Communicating Stories with Data | Represent Multivariable data | Measuring and plotting | Plotting patterns |
| Communicating Stories with Data | Fractions of shape and time | Rectangle Investigations | Telling a data story |
| Communicating Stories with Data | Measuring | n/a | n/a |
| Exploring Changing Quantities | Addition and subtraction patterns | Number and shape patterns | Telling a data story |
| Exploring Changing Quantities | Number flexibility to 100 | Factors & area models | Factors and groups |
| Exploring Changing Quantities | n/a | Multi-digit numbers | Modeling |
| Exploring Changing Quantities | n/a | n/a | Fraction connections |
| Exploring Changing Quantities | n/a | n/a | Shapes on a plane |
| Taking Wholes Apart, Putting Parts Together | Square tiles | Fraction flexibility | Fraction connections |
| Taking Wholes Apart, Putting Parts Together | Fractions as relationships | Visual fraction models | Seeing Division |
| Taking Wholes Apart, Putting Parts Together | Unit fraction models | Circles, fractions and decimals | Powers and place value |
| Discovering shape and space | Unit fraction models | Circles, fractions and decimals | Telling a data story |
| Discovering shape and space | Analyze quadrilaterals | Shapes and symmetries | Layers of cubes |
| Discovering shape and space | n/a | Connected problem solving | Shapes on a plane |
The upper-elementary grades present new opportunities for developing and extending number sense. There are four big ideas related to number sense for grades 3–5 including:
- extending flexibility with numbers,
- understanding the operations of multiplication and division,
- making sense of operations with fractions and decimals, and
- using number lines as tools.
As students learn to think about numbers flexibly, by composing and decomposing numbers, they will learn to recognize the inverse relationship between addition and subtraction and between multiplication and division. An important component of “fluency” is being flexible with numbers; rather than a focus on being fast with computation or the use of damaging timed tests (Boaler, 2019). If students are given meaningful explorations with numbers and number patterns, they will develop memories of mathematics facts, and the memories will be meaningful and conceptual. As students learn in these grades to identify and express patterns, both visually and numerically, they will build foundations for proportional reasoning when thinking about the connections between units. In fifth grade, the flexibility students have developed with numbers can be applied to fractions and to the place value system.
Students in the upper-elementary grades learn to conduct data investigations, which include asking and answering questions that are of interest to them. They learn to collect and analyze data, determine, and confirm results, and communicate their findings. While the data visualizations set out in the standards in these grades only include picture graphs, bar graphs, and line plots, students do not need to be restricted to these.
Students investigate patterns and relationships in two- and three-dimensional space, and they begin to use the coordinate plane to represent and question relationships. As students learn about three-dimensional space, they build understanding of the volume as a quantity of unit cubes that fill the space of a solid. Students study time as a measure and connect the central angles of a circle to the clock face and hands. The study of the clock face is another area for connections between numbers and fractions, as students learn about and communicate detailed measures of time.
Students who are English learners are encouraged to use their developing English and native language assets and draw on their prior knowledge. Teachers can examine text and tasks for key language forms and structures, and general as well as discipline-specific, high-utility academic vocabulary words linked to the big ideas and connections. Teachers can provide purposefully planned and “just-in-time” scaffolds and supports to engage EL students in sustained mathematical discourse in multiple contexts to build academic language and knowledge.
The following vignette highlights an educator who is using digital tools to allow students to better visualize concepts introduced at this grade span.
| Vignette Pace, Flexibility, and Grace—Teaching Math During Times of Change At the end of the 2015-16 school year, 32-year veteran math teacher Jean Maddox participated in a three-year professional development program with the County of Tulare Office of Education. The Central Valley Network Improvement Community program or CVNIC was, as the Visalia Unified teacher reflects, “The best professional development I have ever participated in.” Jean, who has taught 5th grade for the last 20 years, worked with other teachers in the program and mathematics researchers, Jo Boaler and Graham Fletcher, to learn new math strategies while applying their knowledge using the PDSA cycle (Plan, Do, Study, Act). Little did she know then just how useful those skills would become in 2020. Forced by the pandemic to teach remotely in 2020, Jean rose to the challenge by adapting, collaborating, and innovating. Even though much had changed with respect to how Jean connected with her students this past year, the more important stuff—the motivation behind her work, the aspirations that motivate her students, even the personal character of her outreach—remained. Flexibility with numbers is a crucial aspect of Jean’s work with her students, making sure they are confident and comfortable with the way they see and manipulate numbers. Often, Jean encourages students to explain the problem they are working on in two ways, with numbers and then visually. “How they see it, in my opinion, also shows how flexible they are with numbers,” Jean says. “This especially helps when we are solving math stories with fractions. How the story makes sense in their head, to match it up with a visual they have drawn; finally, their thinking allows me to see their true understanding (or misconceptions) of the problem.” In the distance learning setting, Jean works with tasks from YouCubed that are a “low-floor/high-ceiling” and fit well for 5th graders beginning to look for patterns to explain their thinking–both visually and numerically. Using flexibility allows Jean’s students to develop the idea of efficiency when doing long division, a key concept developed at this grade span. “For a lot of my students, using the area model, whether it be for multiplication or division, allows them the chance for a visual/conceptual image with numbers, especially division,” Jean states. For long division, the area model is a way to organize the method of Partial Quotients, which allows Jean’s students to work with numbers they are comfortable with when they are dividing. The model enables them to connect to the understanding of areas that they learned in third grade. Jean’s teaching method engages all learners. For EL students, Jean has found success through math stories (word problems). “Students draw out what they understand first (because visualizing the math before calculation shows true understanding),” says Jean. “I provide a process where students can share their thinking, whether it be by partner discussions, acting out the problem, explaining their drawings, and then finally doing the number work (calculations) is the last step.” The process allows Jean to drop in on her students’ thinking process, which indicates to her what the next steps are for working with each student. Math manipulatives to represent concepts introduced at this grade span are central in Jean’s students’ work. “Anything from fraction strips, tangrams, Unifix cubes, centimeter cubes, rulers, protractors are used daily; the students can use the manipulatives they are the most comfortable with,” says Jean. It is a norm in her classroom that students may choose the appropriate tools that they need during math. Jean innovated to ensure the pandemic didn’t change the norm. “With technology, during our full-distance learning time, students have access to digital manipulatives because they still need to be able to see and create the math they are being asked to conceptualize.” Jean found the solution in the Math Learning Center website1 and the Toy Theater website2 to access manipulatives for her students’ use. “They have been quite successful in sharing their thinking, so I can see what their misconceptions are and what they understand (formative assessments).” On the first day of math instruction, Jean makes sure students have a clear understanding of whole numbers on a number line, allowing them to make a smoother transition to placing fractions on a number line. Jean found the Math Learning Center website to be a valuable resource for using digital number lines. For foundational algebra skills, Jean uses Jamboard [collaborative digital whiteboard] to have students manipulate equations and SolveMe Mobiles [game-based mathematics website] to help students establish algebraic thinking and reinforce Operations and Algebraic standards from previous grades. Pace is another critical factor in Jean’s teaching. In her classes, whether online or in-person, speed is not an indicator of success. “I strongly disagree with timed tests,” she says. “It only heightens a student’s math anxiety. Watching the anxious look on kids’ faces with the knowledge that they may not finish, which then leads them to feel like a failure and that they are not a math person.” For Jean, timed-tests give students the impression that math is about speed and getting the correct answer – the very opposite of what math is. “In my class, we take time as we are doing math because I want students to think deeply and realize that their math ability does not connect to how fast they can get something done.” Success for Jean is the light bulb moment when a student connects with the work. “When a student can take a number and decompose it so they can add or multiply in a way that makes sense to them, one that is not necessarily the standard algorithm. When they get the correct answer, they look at the teacher and say, ‘This is how I see it!’ That is an amazing experience–especially as their teacher.” |
Grade Three
In third grade, students extend their work from second grade, thinking with groups, to equal groups and rows and columns in multiplication. As students learn to think about numbers flexibly, by composing and decomposing numbers, they will learn to recognize the inverse relationship between multiplication and division. Being flexible with numbers is an important component of fluency, rather than a focus on being fast with computation. The Mathematics Framework defines fluency:
Students who are comfortable with numbers and who have learned to compose and decompose numbers strategically develop fluency along with conceptual understanding. In the past, fluency has sometimes been equated with speed, which may account for the common, but counterproductive, use of timed tests for practicing facts. But in fact, research has found that, “Timed tests offer little insight about how flexible students are in their use of strategies or even which strategies a student selects. And evidence suggests that efficiency and accuracy may actually be negatively influenced by timed testing.”
To learn more about why timed tests can be replaced with number sense activities see Boaler, Williams, and Confey (2015).3 Being flexible is a big idea and one which draws from connections between numbers and patterns. When students develop number sense, they have a flexible internal framework that they can draw upon when working with any mathematics. Note that while students in third grade do begin to divide numbers, they do so using strategies as distinguished from formal algorithms.
Third grade is also the time when fractional thinking begins to become robust and can begin with a deep understanding of one-half that students can build on to understand and visualize other unit fractions.
Students can be given plenty of time to “play” with numbers and fractions, to think about their relative size, and to estimate and reflect on whether their answers make sense (SMP.3, 7, 8). Students in third grade focus on understanding fractions as equal parts of a whole and as numbers located on the number line. They also use reasoning to compare unit fractions (3.NF.1, 2, 3).
In third grade, students can conduct data investigations and interpret data visuals through data talks. Contexts for questions to investigate should expand to include volume and mass measurement (grams, kilograms, and liters, but not compound units, such as cm3) in addition to the length, time, and money contexts from earlier grades (3.MD.A.2). Time measurements are refined to the nearest minute (3.MD.A.1), and length now includes half- and quarter-inches (3.MD.B.4). Beginning ideas of area give another possible context, limited here to areas that can be covered by a whole number of unit squares (3.MD.C.5, 3.MD.C.6).
Students continue refining their understanding of two-dimensional shapes, focusing on the similarities and differences between quadrilaterals. Students make sense of the attributes that make up these important shapes, that can all be composed by triangles. Students will recognize the importance of the triangle as the base unit, which connects with later learning of trigonometry and the method of dividing complex shapes into smaller triangles to find their area. Students investigate and quantify quadrilaterals and learn that area and perimeter are important measures, where perimeter is one dimensional and area is two dimensional. Having conversations about the base unit of measure helps students connect to the ideas of multiplication and division. Connecting numbers and shapes helps students to make other connections and build number sense.
Students who are English learners are encouraged to use their developing English and native language assets (e.g., cognates) and draw on their prior knowledge. Teachers can examine text and tasks for key language forms and structures, in addition to general and discipline-specific, high-utility academic vocabulary words linked to the big ideas and connections. Teachers can provide purposeful scaffolds and supports to engage EL students in sustained mathematical discourse in multiple contexts to build academic language and knowledge. Planned and “just-in-time” scaffolds and supports provide multiple entry points for meaning-making and sharing of ideas in mathematical ways and include representations, expression starters and builders, and targeted vocabulary and language structures (e.g., explanation, descriptions, comparisons, methods, and connections).
Critical Areas of Instructional Focus
Figure 7.2. Grade 3 Big Ideas

Long description: The graphic illustrates the connections and relationships of some third-grade mathematics concepts.
Direct connections include:
- Fractions of Shape & Time directly connects to: Square Tiles, Fractions as Relationships, Unit Fractions Models, Represent Multivariable Data
- Measuring directly connects to: Number Flexibility to 100, Analyze Quadrilaterals, Represent Multivariable Data
- Addition and Subtraction Patterns directly connects to: Number Flexibility to 100, Unit Fraction Models, Analyze Quadrilaterals, Represent Multivariable Data
- Square Tiles directly connects to: Fractions as Relationships, Number Flexibility to 100, Fractions of Shape & Time
- Fractions as Relationships directly connects to: Square Tiles, Fractions of Shape & Time, Unit Fraction Models
- Unit Fraction Models directly connects to: Fractions as Relationships, Addition and Subtraction Patterns, Fractions of Shape & Time, Represent Multivariable Data
- Analyze Quadrilaterals directly connects to: Number Flexibility to 100, Addition and Subtraction Patterns, Measuring
- Represent Multivariable Data directly connects to: Unit Fraction Models, Number Flexibility to 100, Addition and Subtraction Patterns, Measuring, Fractions of Shape & Time
- Number Flexibility to 100 directly connects to: Square Tiles, Analyze Quadrilaterals, Represent Multivariable Data, Measuring, Addition and Subtraction Patterns
Figure 7.2a. Grade 3 Content Connections, Big Ideas, and Standards
| Content Connection | Big Idea | Grade 3 Standards |
| Communicating Stories with Data | Represent Multivariable Data | MD.3, MD.4, MD.1, MD.2, NBT.1: Collect data and organize data sets, including measurement data; read and create bar graphs and pictographs to scale. Consider data sets that include three or more categories (multivariable data) for example, when I interact with my puppy, I either call her name, pet her, or give her a treat. |
| Communicating Stories with Data & Taking Wholes Apart, Putting Parts Together & Discovering Shape and Space | Fractions of Shape & Time | MD.1, NF.1, NF.2, NF.3, G.2: Collect data by time of day, show time using a data visualization. Think about fractions of time and of shape and space, expressing the base unit as a unit fraction of the whole. |
| Communicating Stories with Data | Measuring | MD.2, MD.4, NBT.1: Measure volume and mass, incorporating linear measures to draw and represent objects in two-dimensional space. Compare the measured objects, using line plots to display measurement data. Use rounding where appropriate. |
| Exploring Changing Quantities | Addition and Subtraction Patterns | NBT.2, , OA.8, OA.9, MD.1: Add and subtract within 1000 – Using student generated strategies and models, such as base 10 blocks. e.g., use expanded notation to illustrate place value and justify results. Investigate patterns in addition and multiplication tables, and use operations and color coding to generalize and justify findings. |
| Exploring Changing Quantities | Number Flexibility to 100 | OA.1, OA,2, OA.3, OA.4, OA.5, OA.6, OA.7, OA.8, NBT.3, MD.7, NBT.1: Multiply and divide within 100 and justify answers using arrays and student generated visual representations. Encourage number sense and number flexibility – not “blind” memorization of number facts. Use estimation and rounding in number problems. |
| Taking Wholes Apart, Putting Parts Together | Square Tiles | MD.5, MD.6, MD.7, OA.7, NF.1: Use square tiles to measure the area of shapes, finding an area of n squared units, and learn that one square represents 1/nth of the total area. |
| Taking Wholes Apart, Putting Parts Together | Fractions as Relationships | NF.1, NF.3: Know that a fraction is a relationship between numerators and denominators – and it is important to consider the relationship in context. Understand why 1/2=2/4=3/6. |
| Taking Wholes Apart, Putting Parts Together & Discovering Shape and Space | Unit Fraction Models | NF.2, NF.3, MD.1: Compare unit fractions using different visual models including linear models (e.g., number lines, tape measures, time, and clocks) and area models (e.g., shape diagrams encourage student justification with visual models). |
| Discovering Shape and Space | Analyze Quadrilaterals | MD.8, G.1, G.2, NBT.1, OA.8: Describe, analyze, and compare quadrilaterals. Explore the ways that area and perimeter change as side lengths change, by modeling real world problems. Use rounding strategies to approximate lengths where appropriate. |
Grade Four
Patterning and examining relationships are at the heart of fourth grade. Students begin to think about how to identify and express patterns, both visually and numerically, and build foundations for proportional reasoning when thinking about the connections between units. Students look within fractions and decimals for the relationships represented there—relationships between numerator and denominator, fraction and decimal, and decimal and place value. Fourth graders use relationships to connect multiplication and division and think flexibly across all operations.
After their introduction to multiplication in third grade, fourth-grade students employ that understanding to identify prime and composite numbers and to recognize that a whole number is a multiple of each of its factors. An excellent way for students to see the composition of numbers is the visual number activity.4 Students can also explore the multiplication table and highlight multiples with color or shape, looking for patterns and relationships
At this grade, students develop an understanding of fraction equivalence by illustrating and explaining reasons for their conjectures and ideas. Students can strengthen their knowledge of fraction equivalence by engaging in games that provide practice, such as Matching Fractions or Fractional Wall, created by Nrich Maths.5 Students represent their thinking with diagrams (number lines, strip diagrams), pictures, and equations. This work lays the foundation for further operations with fractions in fifth grade.
Data investigations in fourth grade should include topics of student interest as students learn the ways to collect, analyze, and represent data. Line plots are introduced in fourth grade, and students can learn to create, read, and interpret different data displays, including line plots. When creating line plots, students can include fractional measurements to help bring fractions to life with real data, such as measurement of objects in the classroom or home.
In grade four, students move from seeing vertices as made up of an angle to more formal understandings of angles made of two rays with a common endpoint. The concept of a ray can lead to fascinating discussions of infinity that can captivate students. As students think about the addition of angles, they will again be connecting geometric ideas to number sense. The idea of a central angle of a circle, formed when two rays are joined at the center of a circle can connect with learning about the hands of a clock face. Students can investigate with angles in myriad of ways. Students continue refining their work in measuring and quantifying the world around them by investigations, such as connecting the unit of measure from a square to a cube, as they use area, perimeter of shapes, and the volume of solids. These ideas connect to the operations of addition, subtraction, multiplication, and division. Students connect the unit of measure from a square to a cube as they use area and volume to make sense of space. These ideas can also be connected to fractions and decimals, building visual understandings and helping with the meaning of these operations.
Students who are English learners are encouraged to use their developing English and native language assets (e.g., cognates, morphological awareness) and draw on their prior knowledge. Teachers can examine text and tasks for key language forms and structures, and general as well as discipline-specific, high-utility academic vocabulary words linked to the big ideas and connections. Teachers can provide purposeful scaffolds and supports to engage EL students in sustained mathematical discourse in multiple contexts to build academic language and knowledge. Planned and “just-in-time” scaffolds and supports provide multiple entry points for meaning making and sharing of ideas in mathematical ways and include representations, expression starters and builders, and targeted academic vocabulary and language structures (e.g., problems, explanations, arguments, descriptions, procedures). Teachers guide deconstruction and/or co-construction of problems, investigations, arguments, explanations, descriptions, and procedures.
Critical Areas of Instructional Focus
Figure 7.3. Grade 4 Big Ideas

Long description: The graphic illustrates the connections and relationships of some fourth-grade mathematics concepts.
Direct connections include:
- Number & Shape Patterns directly connects to: Shapes & Symmetries, Connected Problem Solving, Circles Fractions & Decimals, Factors & Area Models, Fraction Flexibility, Multi-Digit Numbers
- Shapes & Symmetries directly connects to: Connected Problem Solving, Circles Fractions & Decimals, Multi-Digit Numbers, Number & Shape Patterns
- Rectangle Investigations directly connects to: Connected Problem Solving, Measuring & Plotting, Circles Fractions & Decimals
- Connected Problem Solving directly connects to: Rectangle Investigations, Shapes & Symmetries, Number & Shapes Patterns, Multi-Digit Numbers, Circles Fractions & Decimals, Factors & Area Models, Measuring & Plotting
- Measuring & Plotting directly connects to: Connected Problem Solving, Rectangle Investigations, Visual Fraction Models
- Visual Fraction Models directly connects to: Measuring & Plotting, Circles Fractions & Decimals, Fraction Flexibility
- Factors & Area Models directly connects to: Connected Problem Solving, Circles Fractions & Decimals, Number & Shape Patterns, Multi-Digit Numbers, Fraction Flexibility
- Fraction Flexibility directly connects to: Factors & Area Models, Circles Fractions & Decimals, Number & Shape Patterns, Multi-Digit Numbers
- Multi-Digit Numbers directly connects to: Number & Shape Patterns, Shapes & Symmetries, Connected Problem Solving, Circles Fractions & Decimals, Factors & Area Models, Fraction Flexibility
- Circles Fractions & Decimals directly connects to: Multi-Digit Numbers, Number & Shape Patterns, Shapes & Symmetries, Rectangle Investigations, Connected Problem Solving, Visual Fraction Models, Factors & Area Models, Fraction Flexibility
Figure 7.3a. Grade 4 Content Connections, Big Ideas, and Standards
| Content Connection | Big Idea | Grade 4 Standards |
| Communicating Stories with Data | Measuring & Plotting | MD.1, MD.4, NF.1, NF.2: Collect data consisting of distance, intervals of time, volume, mass, or money. Read, interpret, and create line plots that communicate data stories where the line plot measurements consist of fractional units of measure. For example, create a line plot showing classroom or home objects measured to the nearest quarter inch. |
| Communicating Stories with Data | Rectangle Investigations | MD1, MD2, MD3, MD5, MD6: Investigate rectangles in the world, measuring lengths and angles, collecting the data, and displaying it using data visualizations. |
| Exploring Changing Quantities | Number & Shape Patterns | OA.5, OA.1, OA.2, NBT.4: Generalize number and shape patterns that follow a given rule. Communicate understanding of how the pattern changes in words, symbols, and diagrams – working with multi-digit numbers. |
| Exploring Changing Quantities | Factors & Area Models | OA.1, OA.2, OA.4, NBT.5, NBT.6: Break numbers inside of 100 into factors. Illustrate whole number multiplication and division calculations as area models and rectangular arrays that illustrate factors. |
| Exploring Changing Quantities | Multi-Digit Numbers | NBT.1, NBT.2, NBT 3, NBT.4, OA.1: Read and write multi-digit whole numbers in expanded form and express each number component of the expanded form as a multiple of a power of ten. |
| Taking Wholes Apart, Putting Parts Together | Fraction Flexibility | NF.3, NF.1, NF.4, NF.5, OA.1: Understand that addition and subtraction of fractions as joining and separating parts that are referring to the same whole. Decompose fractions and mixed numbers into unit fractions and whole numbers, and express mixed numbers as a sum of unit fractions. |
| Taking Wholes Apart, Putting Parts Together | Visual Fraction Models | NF.2, NF.1, NF.3, NF.5, NF.6, NF.7: Use different ways of seeing and visualizing fractions to compare fractions using student generated visual fraction models. Use >, < and = to compare fraction size, through linear and area models, and determine whether fractions are greater or less than benchmark numbers, such as ½ and 1. |
| Taking Wholes Apart, Putting Parts Together & Discovering Shape and Space | Circles, Fractions & Decimals | NF.5, NF.6, NF.7, OA.1. MD2, MD5, MD7: Understand, compare, and visualize fractions expressed as decimals. Recognize fractions with denominators of 10 and 100, e.g., 25 cents can be written as 0.25 or 25/100. Connect a circle fraction model to the clock face. Example 3/10 + 4/100 = 30/100 + 4/100 = 34/100 |
| Discovering Shape and Space | Shapes & Symmetries | MD.5, MD.6, MD.7, G.1, G.2, G.3, NBT.3, NBT.4, Draw and identify shapes, looking at the relationships between rays, lines, and angles. Explore symmetry through folding activities. |
| Discovering Shape and Space | Connected Problem Solving | OA.3, MD.1, MD.2, OA2, MD.3, NBT.3 place value, NBT.4, NBT.5, NBT.6, OA.2, OA.3, G.3: Solve problems with perimeter, area, volume, distance, and symmetry, using operations and measurement. |
Grade Five
In fifth grade, equivalence and flexibility are big ideas, with both particularly relating to operations and fractions. Using relationships in the world to make meaning out of multiplication, division, fractions, and estimation requires a great deal of exploration. Using portion sizes to estimate with fractions is helpful because thinking about portions is a useful and underdeveloped idea that gives fractions meaning and utility. At this grade, students work with powers of ten, use exponential notation, and can explain patterns in the placement of the decimal point when a decimal is multiplied by a power of 10.
Fifth-grade students are expected to fully understand the place value system, including decimal values to thousandths, building from the foundation laid in earlier grades. Ideas to help with decimal understanding include using base ten blocks, with the 3-dimensional cube representing one unit so that students have a tactile, visual model to consider the value of the small cube, the rod, and the 10 by 10 flat. In a virtual environment, students can use a CAD, Tinkercad, or other program to design and build complex shapes. While they are building 3-D representations in a 2-D space, it is important to ask students to think about what makes their 2-D drawings appear to be 3-D. Shapes in this environment may appear to be a parallelogram or a rhombus when they are representing a 3-D object—what the shape of the face really is in 3-D space is a square. Asking students to build their CAD designs out of cardboard or paper is a good way to have them explore the way shapes look when they change the angle of their view.
Another useful tool is a printed 10 x 10 grid. Students visualize the whole grid as representing the whole and can shade in various decimal values. Fifth-grade students use equivalent fractions to solve problems; so, it is important that they have a strong grasp of equality and can use benchmark fractions (e.g., 1/2, 2/3, 3/4) to reason about, compare, and calculate with fractions. Experiences with placing whole numbers, fractions, and decimals on the same number line contribute to building fraction number sense. Students need time and opportunity to collaborate, critique, and reason about where to place the numbers on the number line.
When students in fifth grade conduct data investigations, they ask questions, collect data, analyze results, and communicate their findings. While the data visualizations included in the fifth-grade standards only include picture graphs, bar graphs, and line plots, students do not need to be restricted to these; data in the modern world is represented in many creative and non-standard ways, and it is important that students learn to read such data representations. Also, while standard data representations, such as bar graphs, show repeated measurements of a single varying quantity, science curricula in particular, and many questions of interest in general, require the consideration of relationships between two or more different changing quantities, such as erosion and time (NGSS 4-ESS2-1 Earth’s Systems) or length or direction of shadows and time (NGSS 5-ESS1-2 Earth’s Place in the Universe). Such reasoning involves multiple variables, which is an important aspect of modern encounters with data that students experience. Although the scatter plot, a crucial data representation tool for two varying quantities, is not expected to be fully understood until later grades (8.SP.1), it can be explored informally much earlier for students to be prepared for middle school content. For example, students can plot quantities changing over time (e.g., height of a plant, length of the day, high temperature for the day), with time on the horizontal axis and the changing quantity on the vertical. Once such a plot is created, it is an excellent context for a “notice and wonder” discussion.
Moving to the fore in fifth grade are ideas about patterns and relationships in two- and three-dimensional space. Students begin to use the coordinate plane to represent and question relationships, and they begin to think about how to count and represent volume using cubic units. Providing investigations where students see volume as a visual model of unit cubes contained inside a 3-D shape is important work. Students have ample opportunities to study the volume of complex shapes, e.g., a pyramid, where they construct the volume as layers of unit cubes and grapple with the fractions of unit cubes that make up the volume. This is a way to further connect the meaning of a unit with fractions of a unit. In a virtual environment, students can build complex shapes in Tinkercad or other similar apps. Ask students to create and then hand draw their designs since this will engage different areas of their brain. If students are building complex 3-D designs virtually in a CAD (Computer-Aided Design) space, it is a good idea to ask them to try to construct their designs outside of the computer environment. Ask if they can construct their shape out of cardboard or paper. Was it possible to build the shapes they had drawn? What challenges did you face?
Students who are English learners are encouraged to use their developing English and native language assets (e.g., cognates, morphological awareness) and draw on their prior knowledge. Teachers can examine text and tasks for key language forms and structures, and general as well as discipline-specific, high-utility academic vocabulary words linked to the big ideas and connections. Teachers can provide purposeful scaffolds and supports to engage EL students in sustained mathematical discourse in multiple contexts to build academic language and knowledge. Planned and “just-in-time” scaffolds and supports provide multiple entry points for meaning making and sharing of ideas in mathematical ways and include representations, expression starters and builders, and targeted and high-utility academic vocabulary and language structures (e.g., problems, explanations, arguments, descriptions, procedures). Teachers guide deconstruction and/or co-construction of problems, investigations, arguments, explanations, descriptions, methods, and connections.
Critical Areas of Instructional Focus
Figure 7.4. Grade 5 Big Ideas
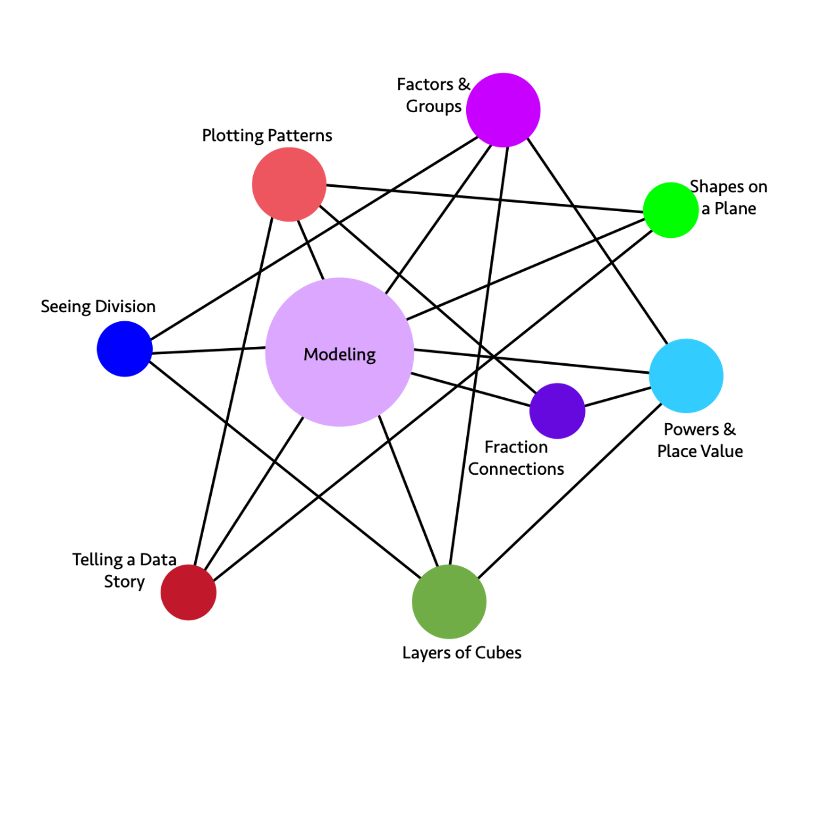
Long description: The graphic illustrates the connections and relationships of some fifth-grade mathematics concepts.
Direct connections include:
- Factors & Groups directly connects to: Powers & Place Values, Layers of Cubes, Modeling, Seeing Division
- Shapes on a Plane directly connects to: Telling a Data Story, Modeling, Plotting Patterns
- Powers & Place Value directly connects to: Layers of Cubes, Fraction Connections, Modeling, Factors & Groups
- Layers of Cubes directly connects to: Powers & Place Value, Factors & Groups, Modeling, Seeing Division
- Telling a Data Story directly connects to: Shapes on a Plane, Modeling, Plotting Patterns
- Seeing Division directly connects to: Layers of Cubes, Modeling, Factors & Groups
- Plotting Patterns directly connects to: Telling a Data Story, Modeling, Fraction Connections, Shapes on a Plane
- Fraction Connections directly connects to: Powers & Place Value, Modeling, Plotting Patterns
- Modeling directly connects to: Plotting Patterns, Factors & Groups, Shapes on a Plane, Powers & Place Value, Fraction Connections, Layers of Cubes, Telling a Data Story, Seeing Division
Figure 7.4a. Grade 5 Content Connections, Big Ideas, and Standards
| Content Connection | Big Idea | Grade 5 Standards |
| Communicating Stories with Data | Plotting Patterns | G.1, G.2, OA.3: MD.2, NF.7: Students generate and analyze patterns, plotting them on a line plot or coordinate plane, and use their graph to tell a story about the data. Some situations should include fraction and decimal measurements, such as a plant growing. |
| Communicating Stories with Data & Exploring Changing Quantities & Discovering Shape & Space | Telling a Data Story | G.1, G.2, OA.3: Understand a situation, graph the data to show patterns and relationships, and to help communicate the meaning of a real-world event. |
| Exploring Changing Quantities | Factors & Groups | OA.1, OA.2, MD.4, MD.5: Students use grouping symbols to express changing quantities and understand that a factor can represent the number of groups of the quantity. |
| Exploring Changing Quantities | Modeling | NBT.3, NBT.5, NBT.7, NF.1, NF.2, NF.3, NF.4, NF.5, NF.6, NF.7, MD.4, MD.5, OA.3: Set up a model and use whole, fraction, and decimal numbers and operations to solve a problem. Use concrete models and drawings and justify results. |
| Exploring Changing Quantities & Taking Wholes Apart, Putting Parts Together | Fraction connections | NF.1, NF.2, NF.3, NF.4, NF.5, NF.7, MD.2, NBT.3: Make and understand visual models, to show the effect of operations on fractions. Construct line plots from real data that include fractions of units. |
| Taking Wholes Apart, Putting Parts Together | Seeing Division | MD.3, MD.4, MD.5, NBT.4, NBT.6, NBT.7: Solve real problems that involve volume, area, and division, setting up models and creating visual representations. Some problems should include decimal numbers. Use rounding and estimation to check accuracy and justify results. |
| Taking Wholes Apart, Putting Parts Together | Powers and Place Value | NBT.3, NBT.2, NBT.1, OA.1, OA.2: Use whole number exponents to represent powers of 10. Use expanded notation to write decimal numbers to the thousandths place and connect decimal notation to fractional representations, where the denominator can be expressed in powers of 10. |
| Discovering Shape and Space | Layers of Cubes | MD.5, MD.4, MD.3, OA.1, MD.1: Students recognize volume as an attribute of three-dimensional space. They understand that a 1-unit by 1-unit by 1-unit cube is the standard unit for measuring volume. They decompose three-dimensional shapes and find volumes of right rectangular prisms by viewing them as decomposed into layers of arrays of cubes. |
| Discovering Shape & Space & Exploring Changing Quantities | Shapes on a Plane | G.1, G.2, G.3, G4, OA.3, NF.4, NF.5, NF.6: Graph 2-D shapes on a coordinate plane, notice and wonder about the properties of shapes, parallel and perpendicular lines, right angles, and equal length sides. Use tables to organize the coordinates of the vertices of the figures and study the changing quantities of the coordinates. |
Sources
[1] https://www.mathlearningcenter.org/apps
[2] https://toytheater.com/category/teacher-tools/virtual-manipulatives/
[3] https://www.youcubed.org/evidence/fluency-without-fear/